Национальный инвестиционный совет
| Вид материала | Доклад |
- Алена нариньяни, 22.17kb.
- Национальный Инвестиционный Совет (нис) общественное объединение, образованное в мае, 2448.69kb.
- Национальный Инвестиционный Совет (нис) общественное объединение, образованное в мае, 4911.31kb.
- Что такое неравенство?, 191.4kb.
- Национальный Фонд развития малого и среднего предпринимательства, 204.46kb.
- Нии общей реаниматологии, 142.73kb.
- Т. П. Белова национальный вопрос в социальных учениях российских конфессий, 145.86kb.
- Дисциплина: «Инвестиционный анализ», 14.98kb.
- Названия организаций, учреждений, предприятий, иностранных фирм, 218.62kb.
- Инвестиционный процесс: основные понятия и показатели, 225.4kb.
Goran Buturac
Ivan Teodorovic*
(Хорватия)
Challenges of Russian and Croatian Economy in Globalization
Summary
The paper analyses main factors of international trade of Russia and Croatia predominantly focusing on the manufacturing sector. Specific part of the paper is devoted to the development of mutual economic relations and their evolution in a foreseeable future. Common characteristic of Croatian and Russian economies lies in fact that a tangible development of industrial production can be secured by enabling key factors of productivity growth and increasing competitiveness to come to full effect. This is first of all related to full scale market reforms, thus influencing investment, the level of competitiveness, the ability to implement innovations derived from increasing levels of outlays for R&D, human capital and applications of new technologies.
Key words: transition, globalization, trade, Russia, Croatia
1. Introduction
Croatia and Russia have followed for almost two decades policy reforms towards the development of sustainable market economies. Though their starting positions differed as did their reform paths it can be noted that both countries have established economic structures by which they can now be recognized as market economies.
In order to reach this position great sacrifices had to be paid in both cases. Reforms of this type, unique in economic history had to deal with changes in the entire social and economic environment. A decade has been devoted to that. The outcome was an unprecedented loss of output, employment and reshuffling international trade relations. The latter has affected both countries in general, and in terms of their mutual achievements as compared with previous ones.
Here it is interesting to note that in a previous study (Teodorovic, Lovrincevic, Buturac, 2005) authors have analyzed similarities in economic structures, sources of growth and international trade patterns for Croatia and Russia. Those patterns are not similar with the experiences demonstrated for most other CEECs.
During the transition period the new EU members and candidate countries have experienced deep structural changes. Transition economies face the challenge of more active inclusion in the European integration process, and one of the key factors on this path is the improvement in trade structure and the competitiveness of the economy. This paper analyses the change in the structure of international trade of goods, which occurred during the process of transition.
The paper is divided into three parts. The first part is a discussion about transition and post transition achievements in Russia, Croatia and transition economies. The empirical results of international trade, levels of intra-industry trade specialization and changes in comparative advantages are shown in the second part. The third section outlines a synthesis of the results from the first and second part of the paper.
2. Transition and post transition achievements
At the beginning of our analysis we will consider the outcomes of the last decade and trends depicted over the last couple of years, as possible indicators of movements and expectations over the future.
The experience of the CEECs over that period in terms of growth as indicated by some basic macroeconomic indicators is in several respects unusual even by emerging market country standards as can be noted from table 1.
Growth of real per capita GDP for the CEECs for the period from 1996 until 2004 and by sub periods as indicated in table 1 was on the average constantly rising and stronger as compared with emerging market economies on the overall (IMF, 2006). According to the same source if real per capita growth rates are compared by regions globally then during the period from the year 2000 until 2004 Baltic countries can be compared with east Asian countries while the remaining CEECs group outpace the leading South American countries.
Table 1. Growth in Real PPP GDP Per Capita Since 1990
| | 1990–2004 | 1995–1999 | 2000–2004 |
| Emerging Market Economies (Selected) | | | |
| China | 7.5 | 5.0 | 8.0 |
| India | 5.6 | 5.0 | 4.0 |
| Indonesia | 3.0 | 0.0 | 3.0 |
| Korea | 6.0 | 4.0 | 4.8 |
| Russia | 0.5 | -1.0 | 7.7 |
| Thailand | 5.6 | 0.5 | 4.6 |
| CEECs | | | |
| Czech Republic | 0.5 | 1.0 | 3.0 |
| Estonia | 2.0 | 5.0 | 7.8 |
| Hungary | 2.0 | 3.0 | 4.5 |
| Latvia | 0.5 | 4.0 | 7.8 |
| Lithuania | 0.6 | 1.0 | 7.6 |
| Poland | 2.5 | 5.0 | 3.5 |
| Slovakia | 1.0 | 4.8 | 4.0 |
| Slovenia | 1.5 | 4.7 | 3.8 |
| Croatia | 4.5 | 3.5 | 4.0 |
Source: Penn World Tables; IMF, World Economic Outlook
The growth experience can be briefly described as:
- Growth was dominated by remarkable increases in total factor productivity (TFP). This is due to the fact that the lag of inefficiencies inherited from the previous economic system has still been present. This left scope for managerial improvements, labor shedding and gains from inter-industry resource reallocation. Thus TFP growth was almost double as compared with the other market economies (IMF, 2006).
- Relatively rapid output growth has been accompanied with massive labor shedding. Employment rates dropped dramatically from the beginning of the transition process. A turnaround has been noted over the last decade and it corresponds to the newly established economic structures. As demonstrated in table 2 over the last couple of years a two-speed catch-up has been noted with respect to employment growth. The group of countries that became members of the EU achieved above average employment growth rates as compared with the others.
Table 2. Employment rates in the CEECs and selected emerging market economies
| Year / Country | 2000 | 2004 |
| Czech Republic | 66 | 66 |
| Estonia | 58 | 62 |
| Hungary | 56 | 59 |
| Latvia | 58 | 61 |
| Lithuania | 60 | 60 |
| Poland | 56 | 51 |
| Slovakia | 57 | 58 |
| Slovenia | 55 | 57 |
| Croatia | | 50 |
| China | | 82 |
| Korea | | 68 |
| Russia | | 68 |
| Thailand | | 75 |
Source: IMF, World Economic Outlook
- At this level of economic development and by now established consumption pattern, domestic savings rates are relatively low. Such savings rates have been supplemented by foreign savings. There is a constant tendency of increasing foreign borrowing and inflows of FDIs. Russian case differs as of lately due to the rising current account surplus stemming mostly from exports of oil and gas and their increasing prices on the world market. Effects of foreign direct investment (FDI) and non-FDI financing are that both have contributed significantly to growth. The inflow of financial resources follows the logic of the game of the “Great Moderation” in the world economy. Liberalization has at first affected the real sector but soon by far more the flow of financial resources. Open financial markets have stimulated investors overall to borrow in low-yielding currencies, and invest in higher-yielding assets. Such movements have induced the growth in domestic currencies in relation to the Euro and especially the dollar over the past years. Fast economic growth and high yields are factors of attraction to which investors can hardly resist. This has encouraged domestic companies to borrow abroad. Thus, it should have led to business expansion and increasing competitiveness and compensate for the strong currency.
- Nevertheless, capital accumulation made modest contribution to growth. If compared with the most dynamic Asian economies the results are much more modest. This depends on the use of such accumulation. According to the sources from the World Economic Outlook, saving rates of the leading emerging market economies in East Asia are twice as high as for the CEECs on the average. The savings rates in CEECs are generally low with the exception for Czech Republic and Slovenia being in the upper half of emerging market economies distribution.
- Investment rates are for the CEECs higher as compared with the savings rates due to various investment sources and instruments (domestic and international). There is a considerable variation in investment rates with Czech Republic, Estonia, Litvia, Slovenia and Slovakia at the higher end of leading emerging market economies. It is obvious that already during the accession phase and especially by obtaining the status of fool membership there was an increase in foreign financial inflows and FDIs. Countries that offered higher levels of market accessibility, higher growth rates and increasing yields on capital invested were more successful than the others. Other phenomena appeared in the form of CEECs becoming investors in the region themselves. A third moment is under development indicating the orientation of the leading CEECs towards the reestablishment of previous trade relations in the region.
- The transition process and its accomplishment led to productivity gains among the CEECs. Numerous studies and reports indicated that productivity gains have accounted for a substantially larger share of growth in the CEECs than in other emerging market economies (IMF, 2006). This was expected from the transition process during which economic and social reforms had the objective to generate modern market economies. Gains in productivity emerged due to within-industry effects and inter/industry gains. As already indicated the increase in output over the later periods has generated efficiency gains per se. In addition process of privatization had twofold impacts. One was increasing orientation towards better achievements due to increased market incentives that made a pressure on the second, upgrading of managerial skills and methods. The openness of CEECs economies, financial inflows and especially FDIs led to the introduction of new technologies and products. The inter-industry efficiency gains originate from structural changes within and among sectors. Significant increases are noted in the service sector which has the fastest rate of growth. Within manufacturing there is a constant decline of the traditional, labor intensive industries and growth of higher and high technology sectors. Only in the case of some countries natural resource endowments play a role of sources of growth and comparative advantage (energy, environment, tourism). The dominant factor of resource reallocation has been investment. The implications of strong productivity growth over the future will depend on investment, development of human capital and further growth and structural adjustments of international trade within the region, the EU and bordering countries and regions.
2.1. Mutual Trade of Croatia and the Russian Federation
Transition from centrally planned economy towards market economy started in Croatia, Russian Federation and other transition economies by the beginning of 90ties through the process of restructuring. Significant parts of structural and institutional reforms take part simultaneously. At the same time liberalization of international trade contributed considerably to the openness of the domestic market. Processes of liberalization and privatization contributed mostly to structural adjustments and to comparative advantages of Croatian and Russian economy in international trade. A foreign trade rose rapidly relative to the GDP growth rate, which has resulted in the considerable growth in the share of trade in GDP.
At the beginning of transition process Russian export and import flows had been heavily concentrated in the former socialist economies and involved various forms of explicit or implicit subsidization. The sudden change in the policy course was exacerbated by the severe economic dislocation of the early 1990s, with further significant effects on the extent, direction, and time profile of adjustment in the external trade sector. Russia experienced large shifts in levels and structure of external trade during the transition period. In terms of levels, the shock of Soviet disintegration caused a trade implosion in 1991–92. This was followed by a steady rebound in 1993–2003, except for a brief slippage in 1997–98 (Lissovolik, B. and Y. Lisovolik, 2006). The main geographical trend was a reorientation away from the former socialist economies toward more advanced market economies.
Croatian real export growth averaged 6 percent annually during 2002–06, significantly below the peer country average (over 10 percent). In contrast to GDP growth, export growth fell compared to the previous period (when it averaged 6.5 percent over 1997–2001). At the same time, recent economic performance has been associated with heightened external vulnerabilities (Moore, Vamvakidis, 2007).
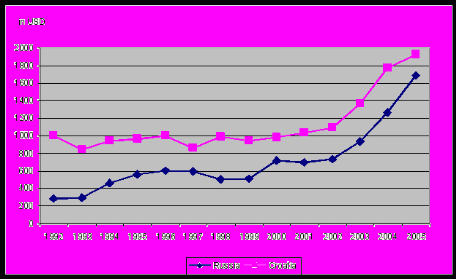
The comparison of export per capita in Russia and Croatia from 1992 to 2005 is displayed on the graph 1. There are great similarities in the movements. Both economies have recorded strong growth of export per capita from 2002 to 2005.
Graph 1. Export per capita in Russia and Croatia from 1992 to 2005
Source: ссылка скрыта
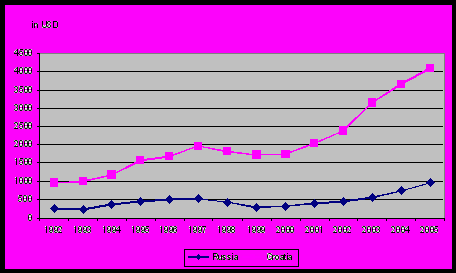
At the same time, import per capita was significantly growing in both counties since 2002 (graph 1). However, Croatian import growth was much stronger. We will discuss about the reasons of these movements in the next part of the paper in which comparative advantages and trade specialization are analyzed.
Graph 1. Import per capita in Russia and Croatia from 1992 to 2005
Source: ссылка скрыта
Croatian export and import per capita is higher than Russian what confirms the theory of international trade by which smaller countries are relatively more exposed to international trade unlike the large countries. In addition, different levels GDP per capita are reflected differences in consumption pattern as well as levels of imports.
3. International trade
3.1. General highlights
At the very beginning of the transition process of Eastern European countries domestic national savings for investment were not sufficient for successful restructuring and competing on the international market. The creation of competitive products resulted in strong demand for appropriate management, know-how, as well as the application of high technology. Despite this, the development and the application of technology that the most developed countries had accomplished up until then created new possibilities for rapid economic growth of the transition countries. First of all this pertains to the fragmentation of the European as well as of the world production processes. Namely, large industrial conglomerates organise production processes in a way that each phase of production is delegated to separate autonomous firm. That kind of production enabled individual firms in transition countries to reconstruct, turning from local markets and integrating themselves into the production chain of large multinational corporations.
Research in the field of international trade showed that the trade in product parts and intra-industry trade was the fastest growing segment in international trade. According to rough estimations, the trade in parts makes 30% of total international trade, for example see Aturupane, Djankov and Hoekman (1997), Kaminski (2001). The phenomenon of fragmentation in production processes that includes firms from various countries is resulting in the appearance of added flows within total trade. Namely, a large part of international trade has been taken over by trade within individual sectors. A larger portion of intra-industry trade in total trade of goods shows a larger integration of an economy in international trade. The characteristic of transition process for Russian and transition economies are the growth in trade specialization and liberalization which are significant factors of industrial restructuring.
For the countries in transition processes to be included in globalization, it is necessary to know with which goods and/or firms and/or economic areas they are to be leaders, followers or outsiders in that process of globalization. They need think about their best economic characteristics, which can supply on the world, and with it, they would have high economic results or opposite, unsatisfied results from the economic integrations.
3.2. Empirical Analysis
The purpose of this paper is to analyze the change in the trade structure of selected transition economies, as well as to explain the noted similarities and differences in the dynamics in comparative advantages and in intra-industry trade specialization. The analysis uses the indicators that offer information about the comparative advantages of each group of products, trade similarities, as well as intra-industry trade specialization. The level of intra-industry trade specialization was analyzed by applying the Grubel-Lloyd Index (GL). Revealed Comparative Advantage (RCA) was used for the analyses of comparative advantages. Average deviation of RCA indicators were used to explain whether these countries are complementary or competitive.
3.2.1. Methodology
For the purpose of comparative advantages and intra-industry trade analysis, products that are subject to international trade are classified into appropriate product groups. The level of intensity of the use of productive factors necessary for the production of the products is used as the criteria for classifying goods. Products are classified into the following five groups:
- Raw material-intensive goods (SITC252 groups: 0, 21, 22, 23, 24, 25, 27, 28, 29, 32, 33, 34, 4, 56),
- Labor-intensive goods (SITC groups: 26, 61, 63, 64, 65, 66, 69, 81, 82, 83, 84, 85, 89),
- Capital-intensive goods (SITC groups: 1, 35, 53, 55, 62, 67, 68, 78),
- Easy to imitate research-oriented goods (SITC groups: 51, 52, 54, 58, 59, 75, 76),
- Difficult to imitate research-oriented goods (SITC groups: 57, 71, 72, 73, 74, 77, 79, 87, 88).
The classifications of products mentioned above, as well as the division into five groups of products are often used in the analysis of international trade of goods. Detailed product groups classifications are in the appendix.
The empirical analysis of the trade pattern in Croatia was calculated using the following indicators:
- “Grubel-Lloyd Index”, GL index;
- “Relative Unit Value” (RUV indicator);
- “Revealed Comparative Advantages” (RCA indicator).
The GL index shows the level of intra-industry trade specialization. The methodologies and calculations of the GL index were developed and applied by Grubel and Lloyd (1975).253. For individual product groups the GL index is calculated using the formula:
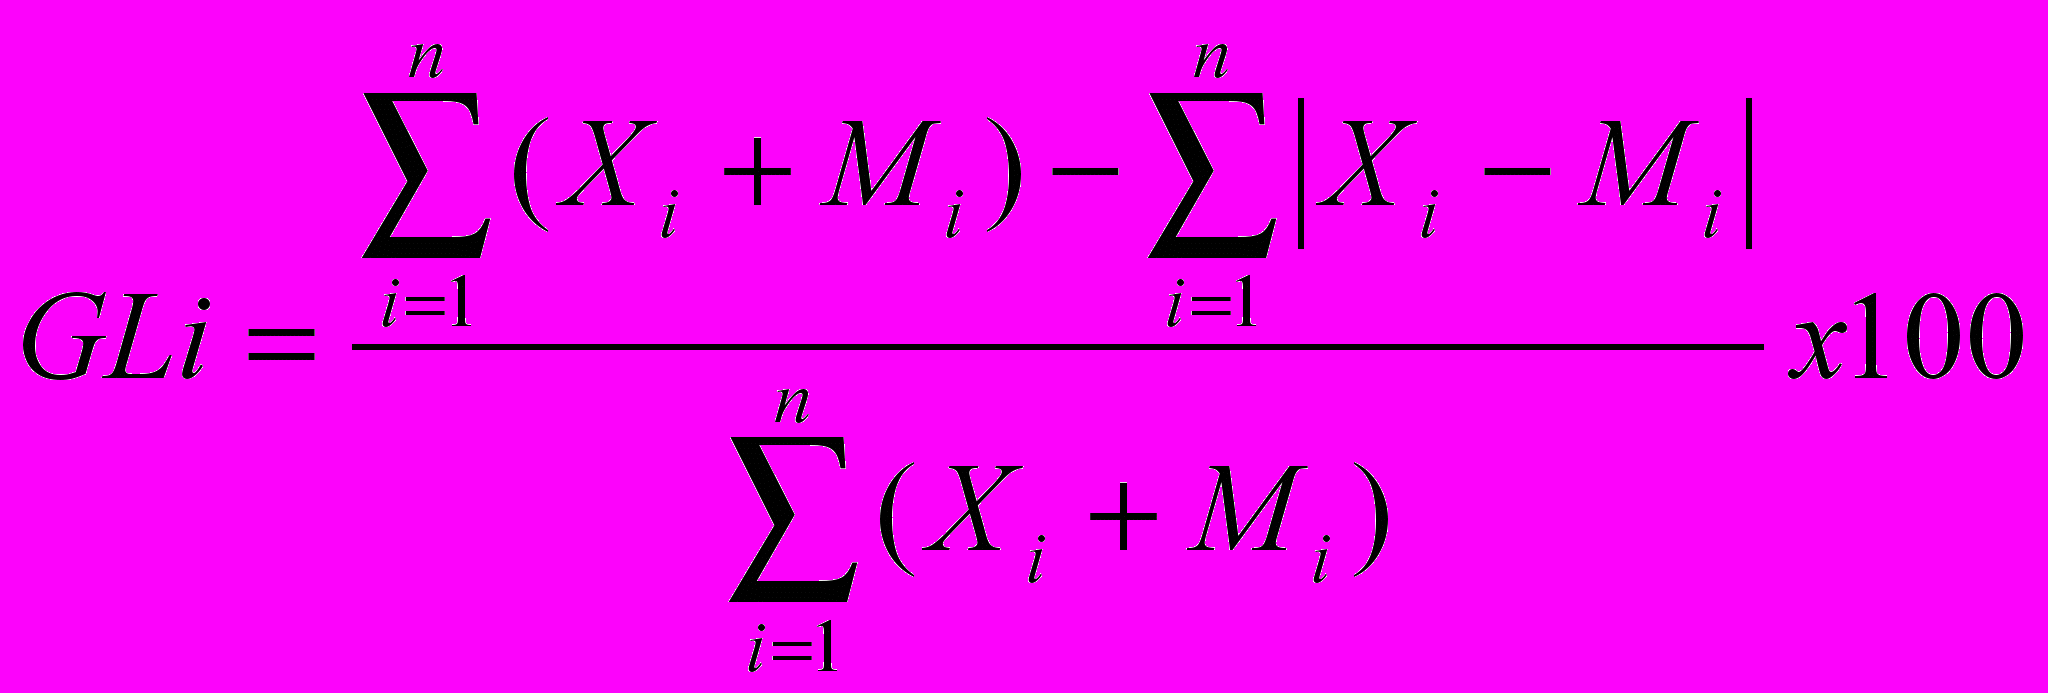
 is the value of the Grubel-Lloyd index for product group i.
 is defined as the value of exports, and
 is the value of imports. The coefficient can vary from 0 to 1. The closer it is to 1, the higher the degree of specialization in intra-industry trade. A lower value of the coefficient shows that the country has a higher level of specialization in inter-industry trade.
The methodology for calculating the RCA indicator was originally developed by Bela Balassa (1965). Later, numerous derivations originated from this indicator. The RCA indicator is useful for the purpose of comparing comparative advantages for individual product groups254. The RCA indicator is calculated by the formula:
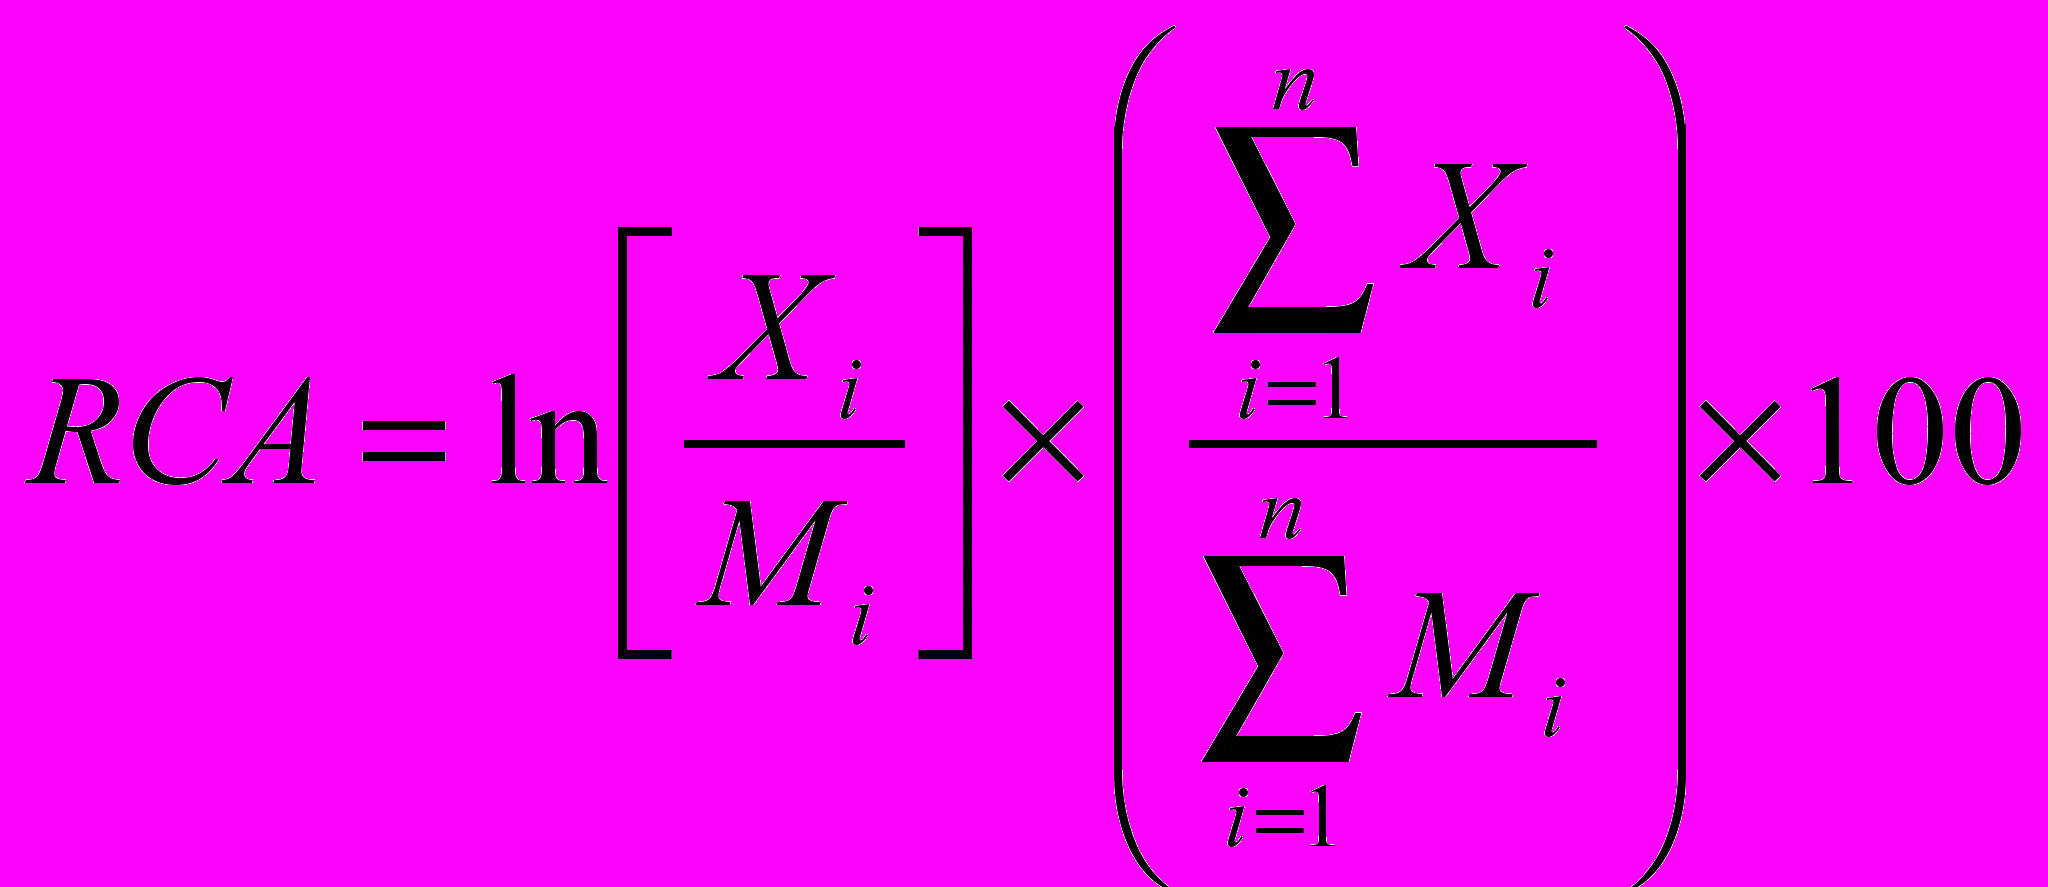
X is defined as the value of exports, while M is the value of imports. Index i is the product group classified according to SITC. A positive value indicates that the country has comparative advantages in the corresponding product group. Conversely, a negative sign for the RCA indicator implies that there are no comparative advantages.255 An alternative for RCA indicators is the Lafay's RCA index. Compared to Balassa's RCA indicator, Lafay's index takes in regard the flows of trade inside each sector of the economy, GDP as well as exports and imports for each group of products.256
Besides Balassa's RCA indicator and Lafay's index, the export structure can be analyzed by using the CEP (Comparative Export Performance) indicator.257
The analysis of the trade similarities between Russia and Croatia is made using the average deviation of the RCA indicator in Croatia compared to Russia. The average deviation of the RCA indicator is calculated using the formula:
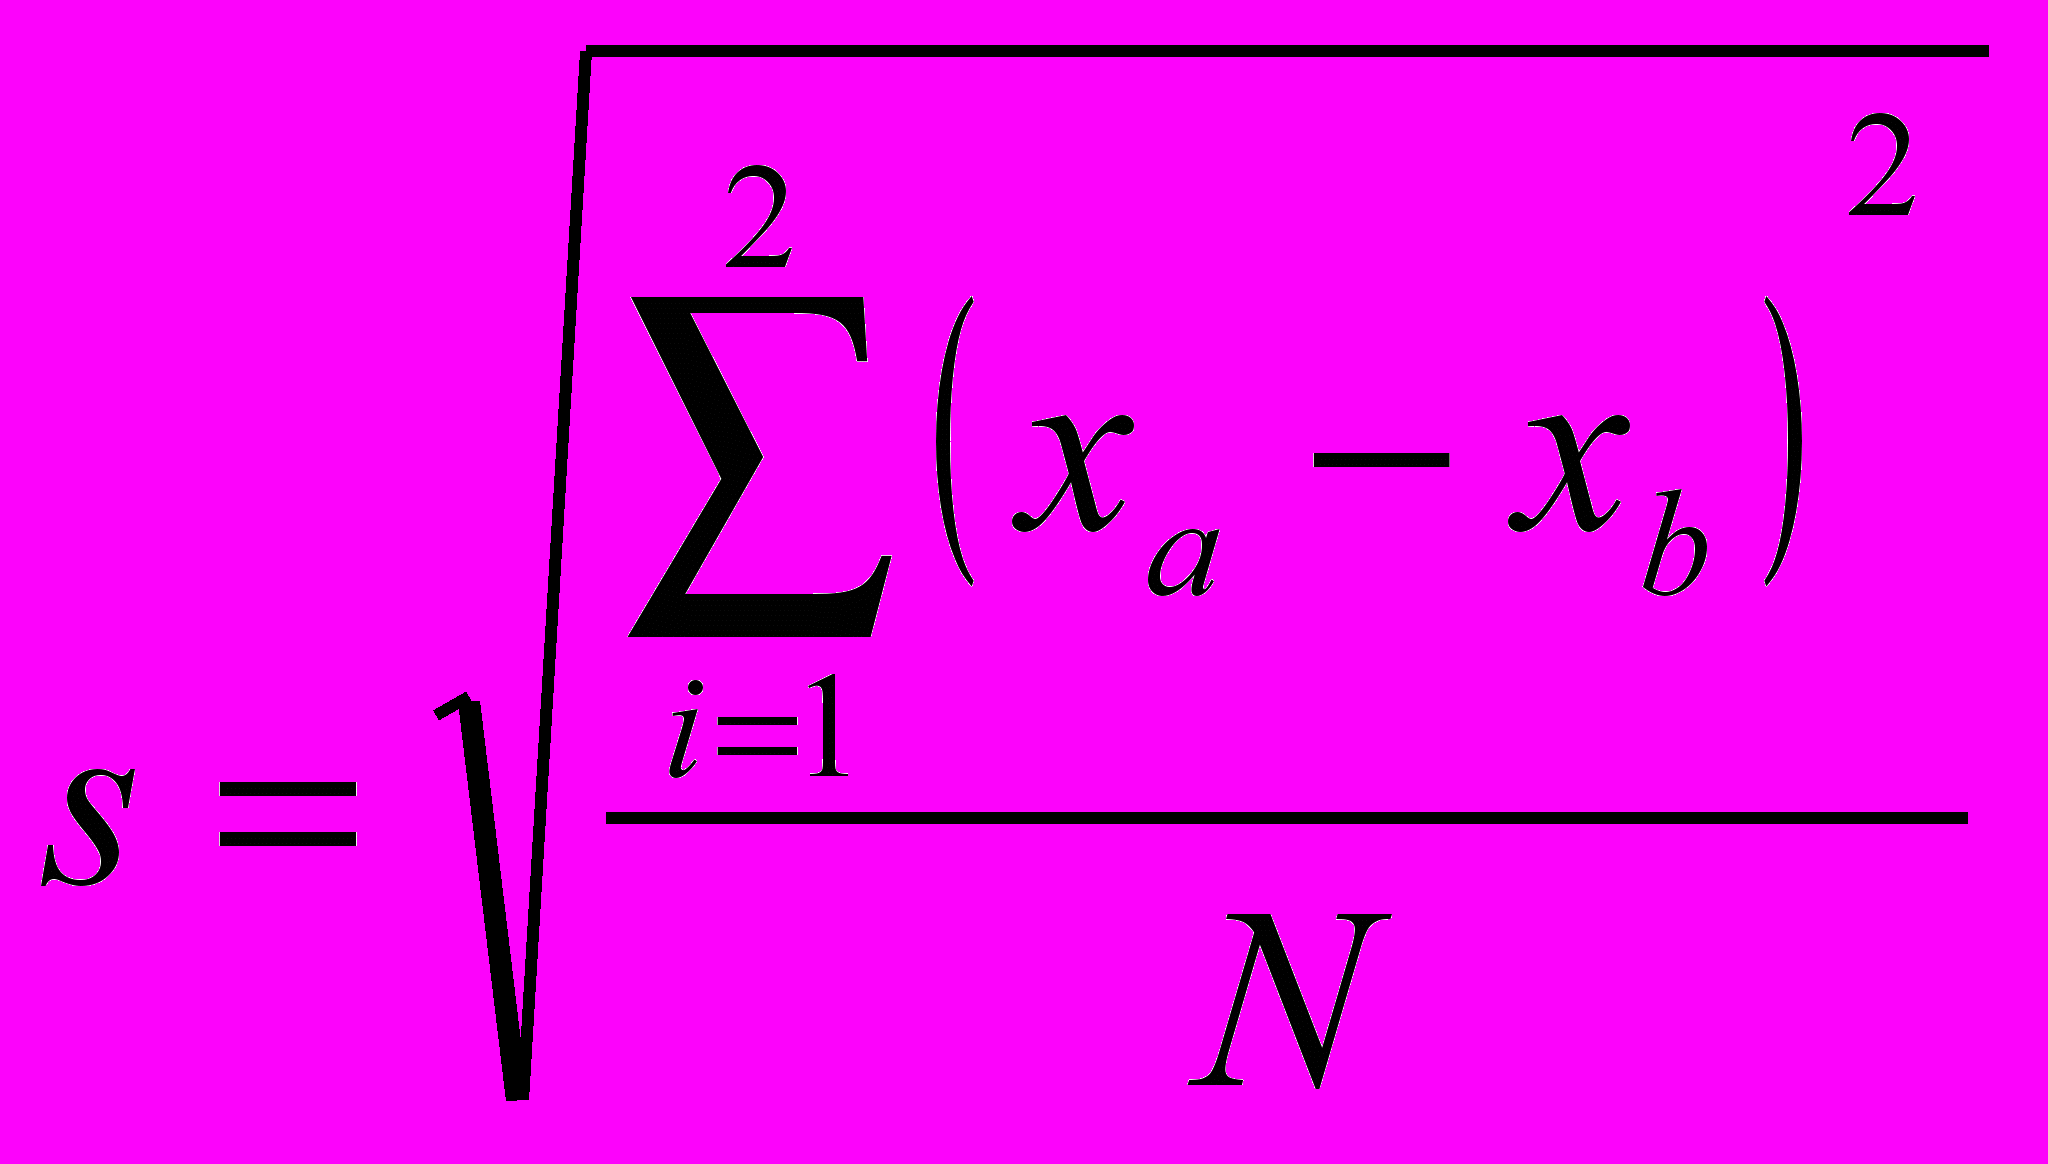
where:
 is the average deviation RCA indicator for Croatia compared to Russia, it can assume values of 1, 2; in which 1 denotes raw material goods and labor-intensive goods, while 2 is capital-intensive goods, easy to imitate and difficult to imitate research-oriented goods,
  is the RCA indicator for Croatia
 is the RCA indicator for Russia
 is the number of product groups. In our case N=2.
A large average deviation of RCA indicators indicates a greater difference in trade structure between two countries (the countries are complementary). Conversely, a low deviation of RCA indicators indicates a greater similarity in the trade structure between two countries (the countries are competitive). An alternative measure for comparing the structures of international trade between countries is the Export Similarity indicator (ES)258.
3.2.2. Relevance of comparative advantages
What economists usually want to know is what happens with the trade structure when an increase in the international trade is evident. Namely, we can ask does an increase in the international trade correspond to improvements in the trade structure. A positive change implies a change in comparative advantages towards more value added product groups. This section analyses the question of a change in comparative advantages while the problem of intra-industry trade specialization is considered afterwards.
For the analyses of comparative advantages the RCA indicator was calculated for the five product groups using Balassa's formula. The results are displayed in Table 3.
Table 3. RCA indicator in Russia and Croatia
| Russia | 1996 | 2000 | 2004 |
| Raw material-intensive goods | 2.2185 | 5.6851 | 0.1767 |
| Labour-intensive goods | -0.6813 | 0.0420 | -0.5830 |
| Capital-intensive goods | 0.9109 | 0.5950 | 0.3543 |
| Easy to imitate research-oriented goods | -0.4324 | -0.2212 | -0.3801 |
| Difficult to imitate research-oriented goods | -0.7398 | -0.0350 | -0.4351 |
| | |||
| Croatia | 1996 | 2000 | 2004 |
| Raw material-intensive goods | -0.2537 | -0.2797 | -0.2723 |
| Labour-intensive goods | 0.0086 | -0.1361 | -0.2441 |
| Capital-intensive goods | -0.8437 | -0.9062 | -0.7948 |
| Easy to imitate research-oriented goods | -0.1853 | -0.3499 | -0.6462 |
| Difficult to imitate research-oriented goods | -0.3948 | -0.1516 | -0.1817 |
Source: own calculations.
Compared to Croatia Russia has comparative advantages in the production and trade of raw material-intensive goods and capital-intensive goods. Comparative advantages of Russia are based on high level of export in oil and gas. Namely, Russia is a major player in world energy markets. It has more proven natural gas reserves than any other country, is among the top ten in proven oil reserves, is the largest exporter of natural gas, the second largest oil exporter, and the third largest energy consumer. Energy exports have been a major driver of Russia’s economic growth over the last five years, as Russian oil production has risen strongly and world oil prices have been very high. This type of growth has made the Russian economy dependent on oil and natural gas exports and vulnerable to fluctuations in oil prices. Comparative advantages for the capital intensive goods are primarily consequence of great level of export in iron, steel, aluminum, silver and cooper. Croatia does not have a comparative advantage in any group of products in 2004, partly explained by the prevalent structure of export services. The value of RCA indicator for each product group during the observed period indicated that the structure of Croatian trade is moving in the expected direction, but significantly slower relative to countries which joined the European Union in 2004 (Buturac, 2005).
3.2.3. Russia and Croatia – similarities and differences
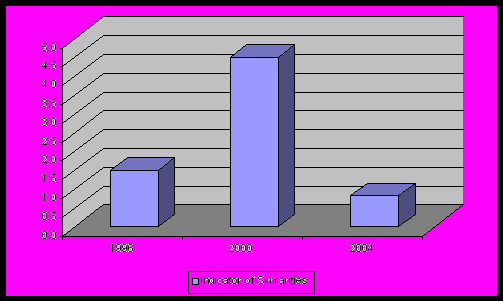
The paper so far has analysed changes of absolute and relative RCA indicators according to individual product groups. However, we now move on to the question of similarities in the structure of trade, analysing whether Croatia has a complementary or competitive structure with the analysed transition countries. The analysis is made using the average deviation of the relative RCA indicator in Croatia compared to analysed transition country by product groups. The empirical results calculated from the average deviation in RCA indicators of Croatia in relation to Russia are shown on Graph 1.
Graph 1. Indicator of similarities between Russian and Croatian trade structure
Source: own calculations.
Croatia has more diversified trade structure relative to Russia. Russian trade structure seems to be complementary, not competitive to Croatia. Russia’s revealed comparative advantage (RCA) in recent years has been in natural resources, especially hydrocarbons, and energy-intensive basic manufactures (steel, aluminium, nickel, fertiliser), plus some other commodities. Moreover, the RCA in oil has been growing strongly in recent years, as the oil sector has increased exports much faster than any other important sector. In any case, more than 50 per cent of Russian exports consist of oil, oil products and gas. Even if Russia managed sharply to increase exports of more sophisticated manufactures,5 their contribution to total export growth would remain modest for some years to come, given their small share in current exports. Basic manufacturing in energy-intensive sectors may also be able to make some contribution to future export growth, although part of their competitive advantage will be eroded by necessary increases in domestic energy prices and by exchange-rate appreciation. In any case, recent experience suggests that potential export growth in these sectors may be constrained by the threat of protectionist measures on the part of Russia’s trade partners.
During transition Croatia has recorded a significant loss of comparative advantages by traditional export branches of industry. Among them are production of food and beverages, textile industry and chemical industry. Comparative advantages are present only within a couple of industrial sectors. Those are the ones with a low value added component.
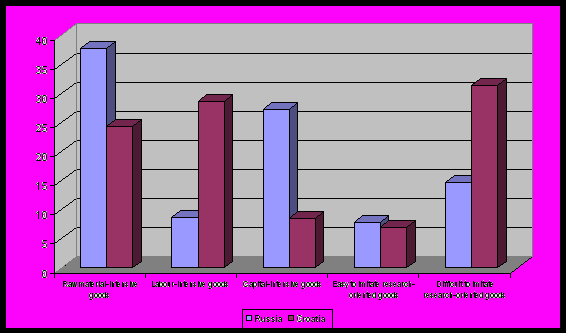
Graph 2 shows the comparison in the Russian and Croatian export structure in 2004.
Graph 2. Comparison in the Russian and Croatian export structure in 2004
Source: own calculations
Raw material intensive goods and capital intensive goods are prevailed in Russian trade structure. Croatia has more diversified export structure and a domination of low value added products.
3.2.4. Intra-industry trade specialization in Russia and Croatia
During the 1990s, Russia, Croatia, Central and Eastern European countries (CEECs) liberalized and reformed their economies. Differences in liberalization processes, manufacturing bases, administrative reforms and political frameworks manifested themselves as differences in trade structure and comparative advantage In the following analyses, we therefore give an examination of the evolution of Russian and Croatian specialization over time. To this purpose, we use the Grubel-Lloyd (GL) index to distinguish between inter-industry specialization and intra-industry trade.
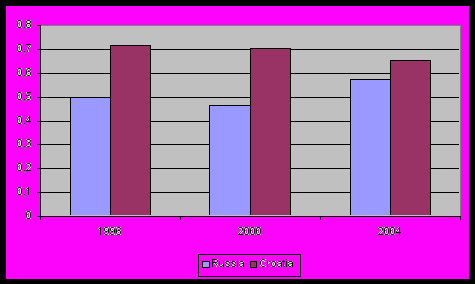
Graph 3 shows the comparison in the Russian and Croatian intra-industry trade specialization.
Graph 3. GL index
Source: own calculation.
Croatia has higher level intra-industry trade specialization relative to Russia, but trends are different. Russia has recorded an increase in intra-industry trade specialization in period 1996-2004, while in Croatia intra-industry specialization has reduced. The EU enlargement to the Central and Eastern countries has also contributed to shape the dynamics and the nature of import-export flows in terms of inter- versus intra-industry trade. Several studies (Aturupane et al., 1997; Kaminski, Ng, 2001) have shown that the revealed comparative advantages of the CEECs in their traditional sectors have decreased as well as their comparative disadvantages. At the same time new advantages have been built up, namely in the engineering industries, electric machinery, electronics and vehicles. Moreover, the level of intra-industry trade between industrialized countries and transition economies, especially the Czech Republic, Hungary and Slovenia have consistently increased, suggesting that the productive structures of the newcomers are converging with those of the most advanced economies. In the group of the most developed transition economies Croatia is an exception because of negative trend in intra-industry trade specialization. It could be partly explained by different structure of FDI in Croatia compared other developed transition economies. Most investments in Croatia were directed toward domestic markets i.e. monopoly or oligopoly positions. Also, a large portion of investments were directed into the non-tradable sector (banking, telecommunications) or investments for the domestic market in the manufacturing industry (for the process of reconstruction of the economy).
4. Conclusion
Russian Federation and Croatian economies during its transition process have been characterized by globalization, privatization and liberalization of market. Integration into the production and marketing arrangements of the multinational corporations rather than the pursuit of an autarchic national development strategy offers the most efficient way to take advantage of growth opportunities offered by the global economy. In this respect the significant role have foreign direct investments.
As the process of economic change and liberalization in Central and Eastern Europe evolve, specialization patterns can be expected to change over time. In this paper we have examined the developments in the trade patterns at national level in Russia and Croatia. Russia has comparative advantages in raw material intensive goods and capital intensive goods and Croatia does not have comparative advantages in any observed product groups. The empirical results confirm both the new trade theory, which predicts an increasing level of intra-industry trade as a consequence of the liberalization process. Overall, Russia and Croatia exhibit mainly specialized intra-industry trade and the tendency appears to increase over time. In Russia, oil and gas are the most important items in the structure of Russian exports.
References
Algieri, Bernadina, “Trade Specialisation Patterns: The Case of Russia”, BOFIT Discussion Papers, 19, 2004
Astrov, Vasily, “The Russian Oil and Gas Sector: Facing the New Challenges” Research Reports, No. 294, WIIW, Februar 2003
Aturupane, Chonira, Simeone Djankov and Bernard Hoekman, “Determinants of Intra-Industry Trade between East and West Europe”, Policy Research Working Paper 1850., The World Bank, Development Research Group, August 1997, pp. 1-31.
Balassa, Bela, “Trade Liberalization and Revealed Comparative Advantage”, The Manchester School of Economic and Social Studies 33, No.2, 1965, pp. 99-123.
Buturac, Goran “Comparative Advantages and Intra-industry Trade: Transition Economies and Russian Federation”, Proceedings of the International Round Table Conference: Comparative Analysis of Economic Transition - Russian Federation, Croatia and the CEE Countries, Teodorović, I., Grinberg, R., Glinkina, S., Lovrinčević, Ž., (ur.), Zagreb: Ekonomski institut, Zagreb, 2005, pp. 59-79.
Djankov, Simeone and Hoekman, Bernard, “Determinants of the Export Structure of Countries in Central and Eastern Europe”, The World Bank Economic Review, Vol 11, No 3, 1997, pp. 471-487.
Donges, Juergen, “The Second Enlargement of the Community”, Kieler Studien 171, Kiel/Germany, 1982
Grubel, H.G. and P.J. Lloyd, “Intra-industry Trade: The Theory and Measurement of International Trade in Differentiated Products”, Macmillan, London, 1975
Havlik, Peter, Michael. Landesmann and Robert. Stehrer, “Competitiveness of CEE Industries: Evidence From Foreign Trade Specialization and Quality Indicators”, Havlik, Peter, “Trade and Cost Competitiveness of the Czech Republic, Hungary, Poland and Slovenia”, Vienna Institute for International Economic Studies, Vienna,, March 1999
IMF, Country Report (2003), “Russian Federation: Selected Issues – Commodity Exporting Country” No.03/146, May 2003
IMF, World Economic Outlook
International Trade Centre, ссылка скрыта
Kaminski, Bartlomiej and Ng, Francis, “Trade and Production Fragmentation: Central European Economies in EU Networks of Production and Marketing”, Working Paper, DECRG-Trade, Worldbank, No.:2611, June 2001
Lafay, Gerard, “The Measurement of Revealed Comparative Advantages” in M.G. Dagenais and P.A. Muet (eds), International Trade Modelling, London: Chapman & Hall, 1992, pp. 209-234.
Lissovolik, Bogdan and Yaroslav, Lissovolik, “Russia and the WTO: The “Gravity” of Outsider Status”, IMF, Staff Papers, Vol. 53, No.1, 2006
Moore, David and Athanasios Vamvakidis, “Economic Growth in Croatia: Potential and Constraints”, IMF, Working Paper 198, 2007
Penn World tables
Schandler Susan, Ashoka Mody, Abdul Abiad, and Daniel Leigh, “Growth in Central and Eastern European Countries of the European Union”, IMF, Occasional Paper 252, Washington DC, 2006
Teodorović, Ivan, Lovrinčević, Željko, Buturac, Goran, “Changes in the Trade Structure of Transitional Economies”, Mir peremen, 3, 2005, pp. 33-42.
Yilmaz Bahri, “The Foreign Trade Pattern and Foreign Trade Specialization of Candidates of the European Union”, Ezoneplus Working Paper, Berlin, No: 19, September 2003
APPENDIX
Classification of products by the intensity of the use of factors of production and the standard international trade classification of products (SITC)
Raw material-intensive goods:
SMTK 0 Food and live animals chiefly for food
SMTK 21 Hides, skins and furskins, raw
SMTK 22 Oil seeds and oleaginous fruit
SMTK 23 Crude rubber (including synthetic and reclaimed)
SMTK 24 Cork and wood
SMTK 25 Pulp and waste paper
SMTK 27 Crude fertiliser and crude minerals
SMTK 28 Metalliferous ores and metal scrap
SMTK 29 Crude animal and vegetable materials, nes
SMTK 32 Coal, coke and briquettes
SMTK 33 Petroleum, petroleum products and related materials
SMTK 34 Gas, natural and manufactured
SMTK 4 Animal and vegetable oils, fats and waxes
SMTK 56 Fertilisers, manufactured
Labour-intensive goods:
SMTK 26 Textile fibres (not wool tops) and their wastes (not in yarn)
SMTK 61 Leather, leather manufactures, nes, and dressed furskins
SMTK 63 Cork and wood, cork manufactures
SMTK 64 Paper, paperboard, and articles of pulp, of paper or of paperboard
SMTK 65 Textile yarn, fabrics, made-up articles, nes, and related products
SMTK 66 Non-metallic mineral manufactures, nes
SMTK 69 Manufactures of metals, nes
SMTK 81 Prefabricated buildings; sanitary, plumbing, heating and lighting fixtures and fittings, nes
SMTK 82 Furniture and parts thereof
SMTK 83 Travel goods, handbags and similar containers
SMTK 84 Articles of apparel and clothing accessories
SMTK 85 Footwear
SMTK 89 Miscellaneous manufactured articles, nes
Capital- intensive goods:
SMTK 1 Beverages and tobacco
SMTK 35 Electric current
SMTK 53 Dyeing, tanning and colouring materials
SMTK 55 Oils and perfume materials; toilet and cleansing preparations
SMTK 62 Rubber manufactures, nes
SMTK 67 Iron and steel
SMTK 68 Non-ferrous metals
SMTK 78 Road vehicles
Easy to imitate research oriented goods:
SMTK 51 Organic chemicals
SMTK 52 Inorganic chemicals
SMTK 54 Medicinal and pharmaceutical products
SMTK 58 Artificial resins and plastic materials, and cellulose esters etc
SMTK 59 Chemical materials and products, nes
SMTK 75 Office machines and automatic data processing equipment
SMTK 76 Telecommunications, sound recording and reproducing equipment
Difficult to imitate research-oriented goods:
SMTK 57 Plastics in primary forms
SMTK 71 Power generating machinery and equipment
SMTK 72 Machinery specialised for particular industries
SMTK 73 Metalworking machinery
SMTK 74 General industrial machinery and equipment, nes, and parts of, nes
SMTK 77 Electric machinery, apparatus and appliances, nes, and parts, nes
SMTK 79 Other transport equipment
SMTK 87 Professional, scientific, controlling instruments, nes, parts
SMTK 88 Photographic equipment and supplies, optical goods, watches, etc
