Research and Consulting предварительные результаты исследования экономическое влияние от участия кыргызской республики в многосторонней торговой системе (вто): сектор текстильной и швейной промышленности
| Вид материала | Документы |
СодержаниеПриложение 2. Результаты тестирования и спецификация эконометрических моделей |
- Верховного Совета Российской Федерации, 1992, n 15 ст. 766, 1993, n 29, ст. 1111; Собрание, 337.78kb.
- Президента Кыргызской Республики, постановлениями Правительства Кыргызской Республики, 230.54kb.
- Обзор публикаций по налоговой тематике в региональной прессе за октябрь 2011 года, 60.08kb.
- Задачи урока : Обеспечить закрепление приемов безопасной работы на швейной машине., 115.8kb.
- Постановление Правительства Кыргызской республики о техническом регламент, 1498.51kb.
- Постановление Правительства Кыргызской республики о техническом регламент, 1341.89kb.
- Правительства Кыргызской Республики от 25 февраля 2004 года №103 «Об утверждении Реестра, 136.97kb.
- Статья Общие положения, 603.92kb.
- Экономическое обоснование к проекту о внесении изменений и дополнений в некоторые законодательные, 87.04kb.
- Президента Кыргызской Республики и депутатов Жогорку Кенеша Кыргызской Республики Принят, 1164.85kb.
Приложение 2. Результаты тестирования и спецификация эконометрических моделей
Спецификация модели №1
| Method: Least Squares | ||||
| Date: 08/08/09 Time: 10:39 | ||||
| Sample: 2001 2006 | ||||
| Included observations: 6 | ||||
| Variable | Coefficient | Std. Error | t-Statistic | Prob. |
| S | 0.871669 | 0.035442 | 24.59409 | 0.0016 |
| I | 0.161061 | 0.015900 | 10.12956 | 0.0096 |
| E | 0.431373 | 0.035332 | 12.20922 | 0.0066 |
| M | -0.466350 | 0.025741 | -18.11694 | 0.0030 |
| R-squared | 0.981769 | Mean dependent var | 103.5833 | |
| Adjusted R-squared | 0.954423 | S.D. dependent var | 3.233213 | |
| S.E. of regression | 0.690252 | Akaike info criterion | 2.331202 | |
| Sum squared resid | 0.952897 | Schwarz criterion | 2.192375 | |
| Log likelihood | -2.993606 | F-statistic | 35.90137 | |
| Durbin-Watson stat | 2.034631 | Prob(F-statistic) | 0.027221 |
Спецификация модели №2
| Dependent Variable: GDP | ||||
| Method: Least Squares | ||||
| Date: 08/08/09 Time: 00:09 | ||||
| Sample(adjusted): 2003 2007 | ||||
| Included observations: 5 after adjusting endpoints | ||||
| Variable | Coefficient | Std. Error | t-Statistic | Prob. |
| S(-2) | -0.432170 | 0.158875 | -2.720184 | 0.0725 |
| C | 151.3297 | 17.10372 | 8.847763 | 0.0030 |
| R-squared | 0.711522 | Mean dependent var | 104.8800 | |
| Adjusted R-squared | 0.615362 | S.D. dependent var | 3.513830 | |
| S.E. of regression | 2.179247 | Akaike info criterion | 4.685011 | |
| Sum squared resid | 14.24736 | Schwarz criterion | 4.528786 | |
| Log likelihood | -9.712527 | F-statistic | 7.399401 | |
| Durbin-Watson stat | 2.383801 | Prob(F-statistic) | 0.072538 |
Результаты тестирования и спецификация модели №3
| Dependent Variable: D(PROD_TXT_WVEI) | ||||
| Method: Least Squares | ||||
| Date: 08/07/09 Time: 17:53 | ||||
| Sample(adjusted): 1996 2008 | ||||
| Included observations: 13 after adjusting endpoints | ||||
| Variable | Coefficient | Std. Error | t-Statistic | Prob. |
| D(PROD_WVEI) | 0.321713 | 0.041104 | 7.826713 | 0.0000 |
| R-squared | 0.836123 | Mean dependent var | 1.376923 | |
| Adjusted R-squared | 0.836123 | S.D. dependent var | 69.00059 | |
| S.E. of regression | 27.93259 | Akaike info criterion | 9.571269 | |
| Sum squared resid | 9362.756 | Schwarz criterion | 9.614726 | |
| Log likelihood | -61.21325 | Durbin-Watson stat | 2.322212 |
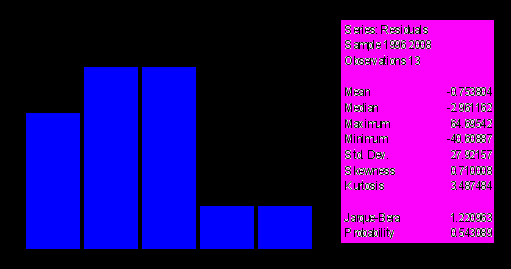
тест Жаку-Берра на нормальность распределения

тест Бреуша Годфри на отсутствие автокорреляции остатков модели
| Breusch-Godfrey Serial Correlation LM Test: | |||
| F-statistic | 2.366827 | Probability | 0.144028 |
| Obs*R-squared | 4.169696 | Probability | 0.124326 |
тест Энгеля на отсутствие авторегрессионной условной гетероскедастичности
| ARCH Test: | |||
| F-statistic | 0.144464 | Probability | 0.711831 |
| Obs*R-squared | 0.170888 | Probability | 0.679324 |
тест Уайта на отсутствие гетероскедастичности (no cross-terms)
| White Heteroskedasticity Test: | ||||
| F-statistic | 0.201052 | Probability | 0.821096 | |
| Obs*R-squared | 0.502529 | Probability | 0.777817 | |
| | | | | |
тест Рамсея на отсутствие ошибок в спецификации модели
| Ramsey RESET Test: | |||
| F-statistic | 2.01E-07 | Probability | 0.999650 |
| Log likelihood ratio | 2.38E-07 | Probability | 0.999611 |
Результаты тестирования и спецификация модели №4
| Dependent Variable: D(PROD_WVEI) | ||||
| Method: Least Squares | ||||
| Date: 08/07/09 Time: 20:06 | ||||
| Sample(adjusted): 2003 2007 | ||||
| Included observations: 5 after adjusting endpoints | ||||
| Variable | Coefficient | Std. Error | t-Statistic | Prob. |
| D(IMP_WVEI) | -0.355113 | 0.198525 | -1.988760 | 0.1116 |
| D(TT_WVEI) | 41.56002 | 14.46075 | 2.873988 | 0.0638 |
| R-squared | 0.687001 | Mean dependent var | -34.62000 | |
| Adjusted R-squared | 0.582668 | S.D. dependent var | 84.92772 | |
| S.E. of regression | 54.86436 | Akaike info criterion | 11.13678 | |
| Sum squared resid | 9030.293 | Schwarz criterion | 10.98055 | |
| Log likelihood | -25.84195 | Durbin-Watson stat | 2.214605 |
тест Бреуша Годфри на отсутствие автокорреляции остатков модели
| Breusch-Godfrey Serial Correlation LM Test: | |||
| F-statistic | 4.449393 | Probability | 0.317840 |
| Obs*R-squared | 4.492034 | Probability | 0.105820 |
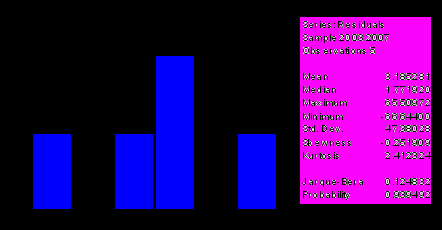
тест Жаку-Берра на нормальность распределения

тест Уайта на отсутствие гетероскедастичности (no cross-terms)
| White Heteroskedasticity Test: | |||
| F-statistic | 509.0847 | Probability | 0.032566 |
| Obs*R-squared | 4.996728 | Probability | 0.172037 |
тест Энгеля на отсутствие авторегрессионной условной гетероскедастичности
| F-statistic | 1.443673 | Probability | 0.352524 | |
| Obs*R-squared | 1.676899 | Probability | 0.195337 | |
| | | | | |
тест Рамсея на отсутствие ошибок в спецификации модели
| Ramsey RESET Test: | |||
| F-statistic | 0.111660 | Probability | 0.770049 |
| Log likelihood ratio | 0.271635 | Probability | 0.602237 |
