Национальный инвестиционный совет
| Вид материала | Доклад |
- Алена нариньяни, 22.17kb.
- Национальный Инвестиционный Совет (нис) общественное объединение, образованное в мае, 2448.69kb.
- Национальный Инвестиционный Совет (нис) общественное объединение, образованное в мае, 4911.31kb.
- Что такое неравенство?, 191.4kb.
- Национальный Фонд развития малого и среднего предпринимательства, 204.46kb.
- Нии общей реаниматологии, 142.73kb.
- Т. П. Белова национальный вопрос в социальных учениях российских конфессий, 145.86kb.
- Дисциплина: «Инвестиционный анализ», 14.98kb.
- Названия организаций, учреждений, предприятий, иностранных фирм, 218.62kb.
- Инвестиционный процесс: основные понятия и показатели, 225.4kb.
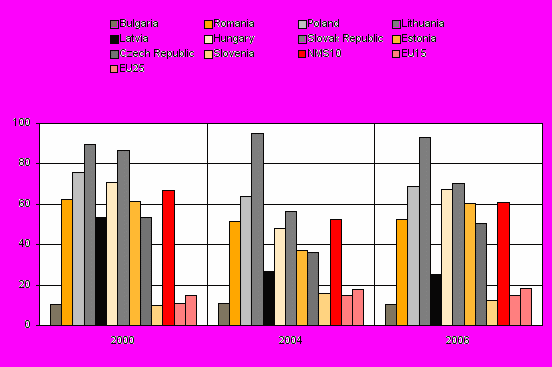
Source : wiiw calculations based on Eurostat Comext database.
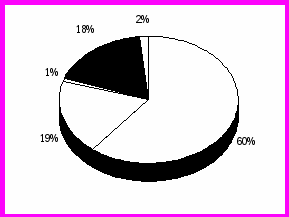
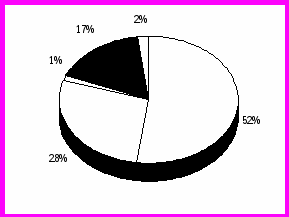
Figure 3
Shares of Russia in EU energy imports, 2000, 2004 and 2006, in % of total

Source: own calculations based on Eurostat Comext Database.
Table 2
Overview of FDI in Central, East and Southeast Europe
| | FDI inflow, EUR million | Per capita | Per capita | |||||||
| | | | | | | | | forecast | inflow EUR | stock EUR |
| | 2000 | 2001 | 2002 | 2003 | 2004 | 2005 | 2006 | 2007 | 2006 | 2006 |
| Czech Republic | 5404 | 6296 | 9012 | 1863 | 4007 | 9374 | 4752 | 5000 | 463 | 5719 |
| Hungary | 2998 | 4391 | 3185 | 1888 | 3633 | 6099 | 4874 | 4000 | 484 | 6170 |
| Poland | 10334 | 6372 | 4371 | 4067 | 10292 | 7703 | 11093 | 12000 | 291 | 2361 |
| Slovakia | 2089 | 1768 | 4397 | 1914 | 2441 | 1694 | 3324 | 3000 | 617 | 3338 |
| Slovenia | 149 | 412 | 1722 | 271 | 665 | 445 | 303 | 400 | 151 | 3133 |
| New Member States-5 | 20974 | 19240 | 22687 | 10002 | 21039 | 25315 | 24346 | 24400 | 370 | 3571 |
| Estonia | 425 | 603 | 307 | 822 | 776 | 2349 | 1282 | 1300 | 954 | 9232 |
| Latvia | 447 | 147 | 269 | 270 | 513 | 582 | 1303 | 1300 | 569 | 2515 |
| Lithuania | 412 | 499 | 772 | 160 | 623 | 826 | 1426 | 1300 | 420 | 2462 |
| New Member States-8 | 22258 | 20489 | 24035 | 13799 | 22950 | 29072 | 28357 | 28300 | 389 | 3590 |
| Bulgaria | 1103 | 903 | 980 | 1851 | 2736 | 3103 | 4104 | 4000 | 533 | 2047 |
| Romania | 1147 | 1294 | 1212 | 1946 | 5183 | 5213 | 9082 | 7000 | 421 | 1432 |
| New Member States-10 | 24508 | 22685 | 26226 | 15051 | 30869 | 37387 | 41544 | 39300 | 407 | 3019 |
| Albania | 155 | 232 | 143 | 158 | 278 | 224 | 259 | 300 | 82 | 603 |
| Bosnia and Herzegovina | 159 | 133 | 282 | 338 | 534 | 421 | 338 | 400 | 88 | 676 |
| Croatia | 1138 | 1502 | 1197 | 1785 | 990 | 1425 | 2838 | 2500 | 639 | 4577 |
| Macedonia | 189 | 493 | 83 | 84 | 126 | 80 | 279 | 200 | 137 | 1028 |
| Montenegro | . | 5 | 76 | 44 | 53 | 393 | 644 | 600 | 1031 | 1943 |
| Serbia | 55 | 184 | 504 | 1204 | 777 | 1265 | 3504 | 3500 | 471 | 1119 |
| Southeast Europe | 1696 | 2549 | 2285 | 3612 | 2759 | 3808 | 7862 | 7500 | 365 | 1693 |
| Belarus | 129 | 107 | 262 | 152 | 132 | 245 | 282 | 300 | 29 | 214 |
| Moldova | 138 | 115 | 89 | 65 | 120 | 160 | 177 | 200 | 45 | 250 |
| Russia | 2933 | 3069 | 3660 | 7041 | 12422 | 10258 | 23047 | 25000 | 162 | 1160 |
| Ukraine | 644 | 884 | 734 | 1260 | 1380 | 6263 | 4148 | 5000 | 89 | 370 |
| European CIS | 3844 | 4175 | 4745 | 8518 | 14053 | 16926 | 27654 | 30500 | 136 | 914 |
| Central and Eastern Europe | 30048 | 29409 | 33255 | 27180 | 47682 | 58121 | 77060 | 77300 | 236 | 1625 |
Source: wiiw Database on Foreign Direct Investments (2007).
Table 3


