IS1024 Project Team 7
| Вид материала | Документы |
- Point Team Services, входящий в состав ms project Server. Основные термины задача, 197.38kb.
- Project Expert 0, 587.79kb.
- Fast Street Team» Зимний Кубок клуба Fast Street Team по ралли-спринту «fst winter, 157.07kb.
- Microsoft Project Server. Microsoft Project Web Access Web-интерфейс для отчет, 98.46kb.
- Член Project Management Institute (pmi). Certified Senior Project Manager (cpm) Сертифицированный, 27.46kb.
- Software Project Management ) (базовый) по направлению: 511600 факультеты: фупм кафедра:, 41.85kb.
- Microsoft Project Portfolio Server Пример внедрения: решение, 374.46kb.
- Microsoft Office Project 2007-2010 программа, 121.65kb.
- Одним из лидирующих инструментов планирования бизнеса в условиях рынка, разработки, 42.42kb.
- Великий Новгород, ул. Псковская,, 12.23kb.
IS1024
Project Team 7
David Azzolina
Philip Boggs
Brian Defranco
Bryce Foster
Mike Smolenski
Mark Wimer
The Beverage Company Incorporated Data Warehouse System
BEVDOT Database Warehouse System
14th, April 2009
Problem/Opportunity Statement #4
Your team works in the IT division of The Beverage Company, Inc. The company produces beverages for sale to other businesses. The financial department wants to track, analyze, and forecast the sales revenue across geographic regions on a periodic basis for all products sold. You already have standard queries of the sales data. However, these queries add to the load on your operational database. Also, users sometimes ask for additional ad hoc queries of the data, based on the results of the standard queries. As a result, senior management at the company has decided to create a data warehouse for the sales data. A data warehouse is a database that contains data that has been cleansed and transformed from an operational format (Create, Read, Update, Delete (CRUD)) into an informational format (user query and report-centric.) Your team’s responsibility is to come up with an overall software solution to address this business opportunity.
Document History/Revision Record
| Revision # | Date | Author(s) | Revision Notes |
| 1.0 | 2/24/09 | David Azzolina, Philip Boggs, Bryan Defranco, Bryce Foster, Mike Smolenski, Mark Wimer | Initial draft |
| 1.2 | 3/12/2009 | B. DeFranco | Initial release – draft (Section 3) |
| 1.3 | 3/15/2009 | M. Smolenski B. Foster P. Boggs | Initial interviews Use-case realization Initial features listed |
| 1.4 | 3/25/09 | M. Wimer | New use cases |
| 1.5 | 3/28/09 | M. Wimer | Additional Use Cases |
| 2.0 | 4/2/2009 | M. Smolenski P. Boggs B. Foster | Add Workshop information First draft of Actors and use cases Additional features added Develop Features for use-case |
| | 4/7/2009 | M. Wimer | Initial Draft (Section 5) |
| 2.1 | 4/10/2009 | B. DeFranco | Add Table of contents. Add Section 13 |
| 2.2 | 4/12/2009 | M. Smolenski B. Foster M. Wimer | Rework of actors and use cases Develop test-cases for use-cases Completing Use Cases and Supp Specs |
| 2.3 | 4/11/2009 | M. Wimer | Finalizing Use Cases |
| 2.4 | 4/13/2009 | P. Boggs M. Wimer | Rework of use cases and prioritization Combined Both SS’s and Modified |
| 2.5 | 4/14/09 | D. Azzolina | Final draft |
Table of Contents
| Fishbone Diagram |
 Current System is overloaded!         |
Comments: The Fishbone Diagram shown above is the first of the Total Quality Management (TQM) tools we used to determine the underlying root cause of the problem statement given to us by senior management. We analyzed cause-and-effect and revealed the causes and key relationships from group brainstorming sessions. The “bones” of the diagram include problems arising among the system, from the lack of reports, from the lack of space, and from the inability to analyze sales data. This diagram gave us crucial insight into our system’s process behavior, and led us into early development of our problem statement. We determined that the main cause was overload on the system.
P
 areto Bar Chart
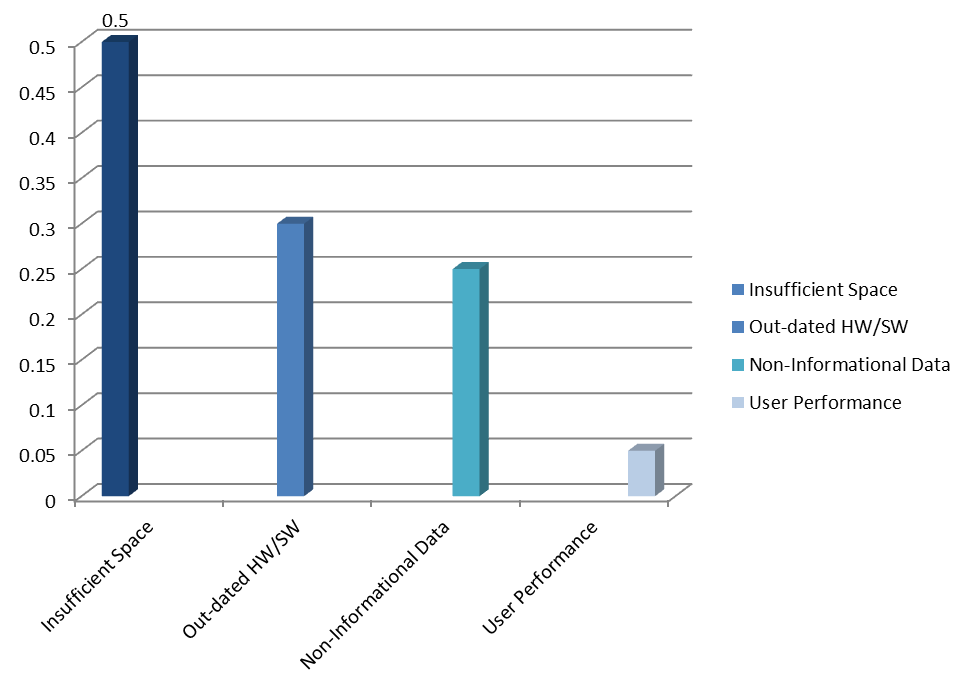

Comments: The Pareto bar chart represents the main problem of overload on the system as defined in the fishbone diagram. We took this root problem of an overloaded system and used it to build a Pareto bar chart with the purpose of further determining the underlying root cause and as a stepping stone in coming up with our own problem definition, and also to highlight the most important cause, or the most frequent reasons for senior management’s complaints.
We found that the highest occurring defect was the limited amount of storage space available (50% of the problem). Then, it was obsolete hardware/software (30% of the problem). The next most common defect was data that had not been cleansed and transformed from an operational format into an informational format (25% of the problem). And finally, employees’ acting on the system whose performance was not meeting the required metrics made up only a small parcel of the overarching problem (5% of the problem).
| Developing the Problem Statement |
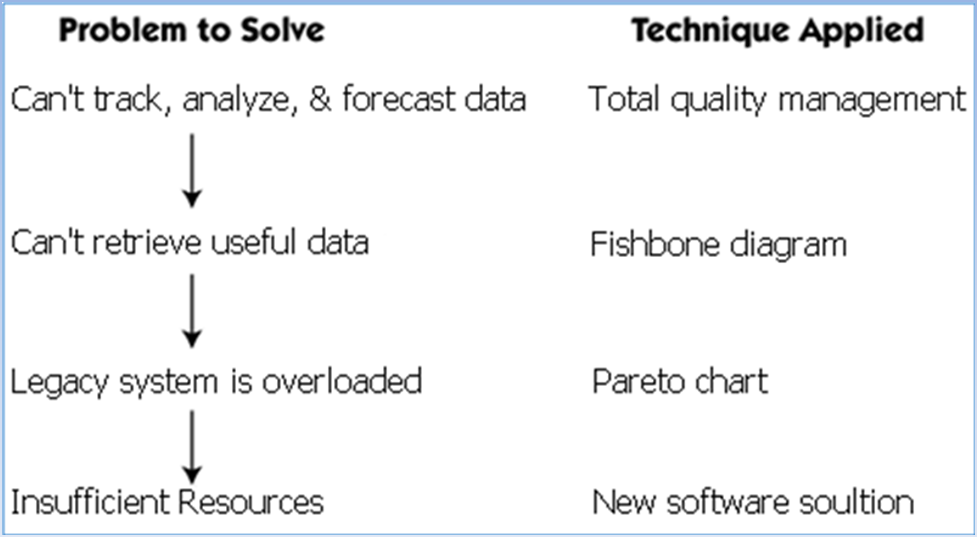 |
Comments: Finally, we put together all of the results of our evolving TQM techniques and used the results to come up with our very own problem definition as this chart shows. This chart illustrates the steps that we took as a group to logically step through our understanding of the root cause, and displays the intermediary problem going back to the original problem given to us by senior management in the problem statement.
| Users and Stakeholders | ||
| ||
| The Financial Department Senior Management | | |
| The Sales Department Our Customers | | |
| The Marketing Department All Beverage Company Incorporated Stock Holders | | |
| The Shipping Department | | |
| IT (Information Technology) Dept. | | |
| Problem Statement | ||
| ||
| The problem of… Insufficient resources. Currently the legacy system delivers only operational data that does not track, analyze and forecast sales revenue. | | |
| Affects… Senior Management, Financial, Sales, Shipping, and Marketing departments. | | |
| And results in… Time consuming queries. Data that is not generated into reports. | | |
| Benefits of a solution… Productivity (Time management/Fast queries). Generation of useful reports. Sales forecast and targeting. | | |
Comments: Our problem definition was agreed upon as a group and is summed in the problem of insufficient resources. This problem involves taking the current legacy database system and doing something to deliver informational data. These changes will affect all of our users and stakeholders. The results will pay off over time and furthermore we will be greatly benefitted by the new system in that we will be able to forecast and target the market based on our sales data.
Comments: This is our compiled list of users and stakeholders.
| Defining Solution System Boundary |
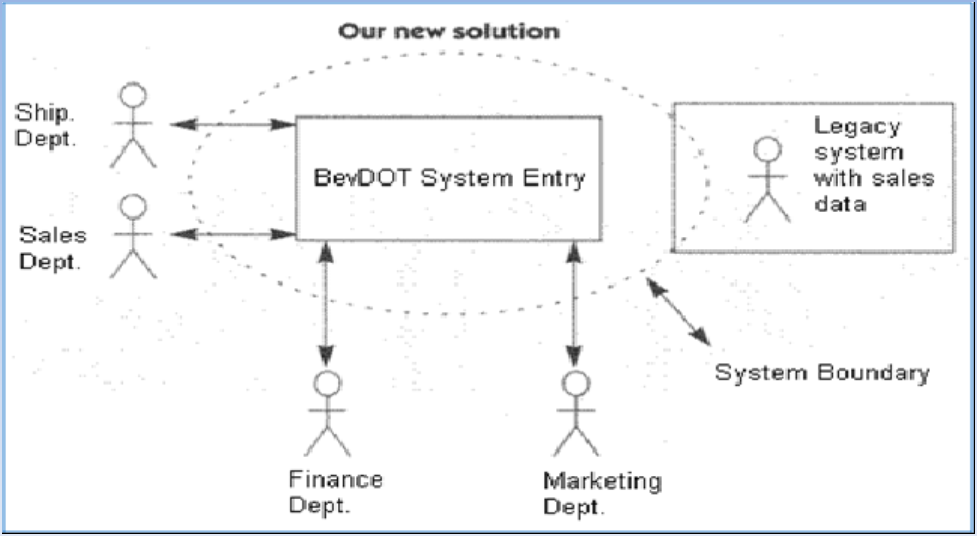 |
Direct interactions with BevDOT
-Legacy System - Sales Department
-Shipping Department - Financial Department
-Marketing Department
| Identify Constraints on Solution | ||||
| ||||
| Equipment Budget | Simple system cost, no new client hardware | Cost control. Maintenance. | ||
| Technology | Solution must be a Database Warehouse. Solution must use current Legacy database. | Increased productivity and profitability. | ||
| Security | Any sensitive customer or user data must be protected and secure. | Prevent information leak, secure company assets. | ||
| Operational | Backed up copies of sales revenue will remain on the Legacy database system for up to 6 months. | High risk of data loss. | ||
Comments: Our constraints are all associated with variables such as Equipment and cost, environment and data security. And all of our reasoning was efficiently justified with critical thinking.
- Introduction
Purpose
The purpose of this section was to elicit and organize the needs of the stakeholders for the BevDot System. The interviews will show what each person and department wanted to see in this system and them will be organized into features and high level use cases. These documents will go though the step by step process; discussions, the workshop and the questionnaire.
- 2.1 Elicit Stakeholder Request
- The interview
The Following is the questions that were taken into each interview. While each interview started the same, it was expected that each interview would end in different directions based on stakeholder responses.
Questions*
- Name?
- Job title?
- What are your key responsibilities?
- How is success measured?
- For what problems do you lack solutions?
- Why does this problem exist?
- How would you like to solve it?
- Who uses the current system
- What is their educational and computer background?
- Are additional applications in use that is relevant to the application?
- What do you expect out of this product?
- What kind of user help do you need?
- What are your expectations of performance and reliability?
*References Managing Software Requirements, Second Edition, Dean Leffingwell and Don Widrig
The following people were interviewed From Beverage Company Inc.
- Dave Smith, CIO
- John Bell, CFO
- Michael Davis, Senior Manager of Marketing
- Jen Jones, Senior Manager of Sales
- Don King, IT Manager
- Bella Mathis, Head of Shipping
The following are the full interviews of each person.
- Dave Smith
- CIO
- “I oversee all information systems for the company”
- “I find that as long as all systems are running well the company runs like a well oiled machine”
- “Our current system Runs Slow”
- “The system is overloaded. There are too many users on it and it takes too long to get the information that our people want.”
- “We need a database warehouse that allows us to spread out the usage of both systems.”
- “Marketing, sales and the senior management some of the time.”
- “Most have a bachelor’s degree, but have only a basic understanding of computers.”
- “Just the standard database programs”
- “I expect to see reporting of the information inputted into the warehouse”
- “Standard online and written texts.”
- “I want to see 24 hour availability with only 1% downtime”
- John Bell
- CFO
- “I oversee all financial transactions, the sales and market departments”
- “Increases sales revenue”
- “I want to see sales forecasting reports and We need to be able to create our own reports”
- “Our current system is limited”
- “Increased functions in the new system”
- “Most of the people in both departments
- “bachelors’ degrees, basic computer knowledge”
- “Not that I am away of”
- “More reports”
- “Any training plus an instruction book”
- “As long as it works that what I want”
- Michael Davis
- Senior Manager of Marketing
- “I oversee the Marketing department”
- “Good response to our marketing campaigns”
- “We need to see sales reports based on a particular region’
- “Our current system does not allow us to see these kind of reports”
- “Add this as a function of a new system”
- “Most of my staff uses the current system”
- “Most of my people have a bachelors’ degree and basic computer knowledge”
- “No Idea”
- “Better reports”
- “Good training of the system”
- “As long as if runs during business hours I’m good”
- Jen Jones
- Senior Manager of Sales
- “I oversee the entire sales department”
- “Increasing sales”
- “We need to see monthly, quarterly or yearly reports”
- “Current system sucks”
- “More reporting”
- “most of my staff uses the Current system”
- “High school diploma or greater and have a typical understanding of computers”
- “ummm….no clue”
- “Better reporting of sales numbers”
- “I just need to know where to click”
- “Make it work”
- Don King
- IT Manager
- “I run to IT department”
- “I am happy as long as everything is running”
- “I would like to see how well the system is running”
- “The current system does not have the functionality that it needs”
- “Increased functionality in the database will allow us to check efficiency also it would be a benefit for us if we have an ETL program that will automatically retrieve the data from the old system and place it in the database warehouse”
- “All of my staff services the current system at some point or another”
- “bachelors or better with solid computer skills”
- “Just the usual Oracle based database program”
- “Efficiency”
- “I won’t need too much”
- “We will keep it running”
- Bella Mathis
- Head of shipping
- “I oversee all parcels in and out of the company”
- “Everything get where its goin’ on time”
- “I need to see where my parcels have gone”
- “The current system does not show this information to us’
- “Be able to print this kind of report when I need to”
- “None of my people do”
- “High school mostly with basic computer skills”
- “No idea”
- “Reports”
- “As much as possible”
- “I’m happy as long as it works”
After talking with each of these people the notes from the interviews were reviewed and the following statements were taken from them. These statements were found important in determining the system features for the BevDot Database warehouse.
Dave Smith
“Our current system runs too slow.”
John Bell
“I would like to see sales forecasting reports”
“We need to be able to create our own reports”
Michael Davis
“We need to see sales reports based on a particular region”
Jen Jones
“I need to see monthly, quarterly or yearly reports”
Don King
“It would be a benefit for us if we have an ETL program that will automatically retrieve the data from the old system and place it in the new database warehouse”
“I would like to see how well the system is running”
Bella Mathias
“I need to see where my parcels have gone”
- Requirements Workshop
After we met with some of the key people in different departments we put together a requirements workshop. We got together people from different departments put them together and discussed the task at hand. The workshop consisted of two days worth of meeting. It included brainstorming sessions, feature definitions and idea reduction and prioritization.
During this workshop we found that some ideas were the same as those that we got from the interview, however, we also got some other ideas that were new. After sorting through everything we found three new points that would lead to features.
Graphical representation of source data
Error handling
User-Friendly GUI
- Questionnaire
The questionnaire was sent out to people in different departments that were not able to attend the requirements workshop. It was an attempt to elicit and more features for the system. The questionnaire contained the same questions that the interviewer had with him. We received very few of the questionnaires back and the ones that we did contained the same ideas from sections a and b.
- Section 2.2 Determine System Features
After all the time was spent speaking with various people and getting responses to our questions we came up with a list of features that the system would need in order to satisfy all of the stakeholders for the system. The following is the features for BevDOT.
- Reports
- Ad-hoc
- Sales Forecasting
- Regional Sales
- Seasonal Sales
- Tracking
- Efficiency
- Ad-hoc
- User-friendly GUI
- Database Warehouse
- Periodic Auto Uploads From Legacy System (ETL)
- Extract Data
- Auto Validation
- Transform Data
- Load Data
- Extract Data
- Manual Validation of Data from Legacy System
- Error Handling
- Graphical representations of Reports
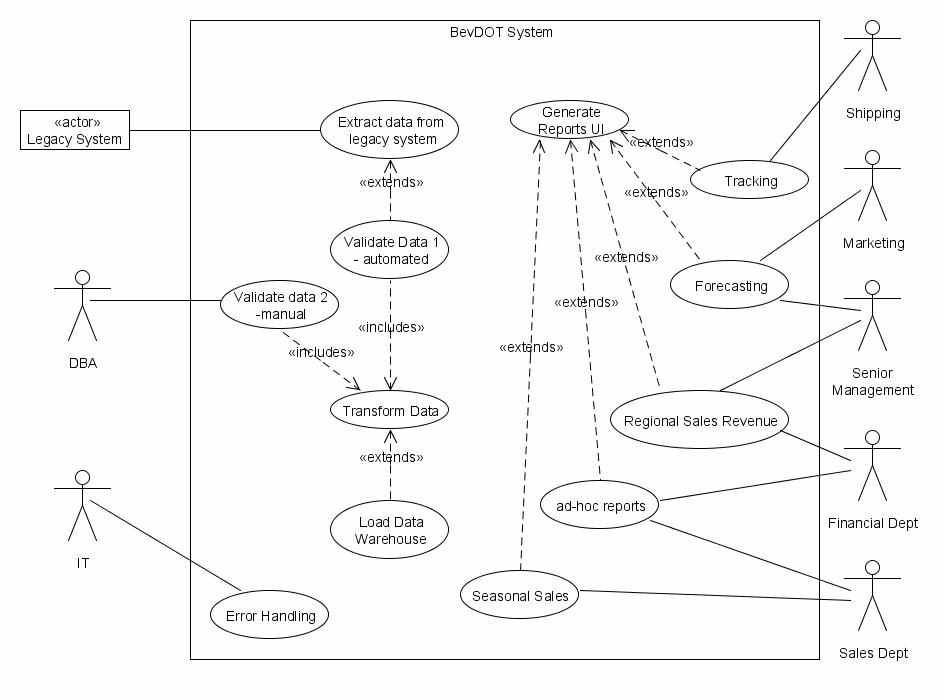
- Section 2.3 Finding Actors and Use cases
- There are four main actors for BevDOT
- The Legacy System – it will be responsible for interfacing with BevDOT to upload new data into the warehouse. It will be the primary actor for the ETL process
- The Financial Department – this includes two groups. Marketing and Sales. They will be the primary actors for most of the reports.
- The IT Department – They will responsible for maintaining and updating BevDOT. They will print the System Efficiency Reports. They also will be responsible for manual validation of any data that is kicked out of the ETL process.
- The Shipping Department – They are the primary actors for the Tracking Reports.
- Uses Cases
The following are the use cases that will be needed in order to complete the system.
- Generate Reports
- Ad-hoc
- Sales Forecasting
- Regional Sales
- Seasonal Sales
- Tracking
- Ad-hoc
- System Efficiency Reports
- The DBA will be able to periodically check the amount of system errors, system load and other important system information.
- The DBA will be able to periodically check the amount of system errors, system load and other important system information.
- Manual Validation
- The IT Department will manually validate any information that is kicked out of the ETL process
- The IT Department will manually validate any information that is kicked out of the ETL process
- Generate Graphs of Reports
- This is for all reports including efficiency reports. The user will be able to have graphs made for presentational or other purposes.
- This is for all reports including efficiency reports. The user will be able to have graphs made for presentational or other purposes.
- Retrieve Data from Legacy System
- ETL Process
- Extract
- Validate
- Transform
- Load Data
- Extract
- ETL Process
Use Case Diagram – First Iteration
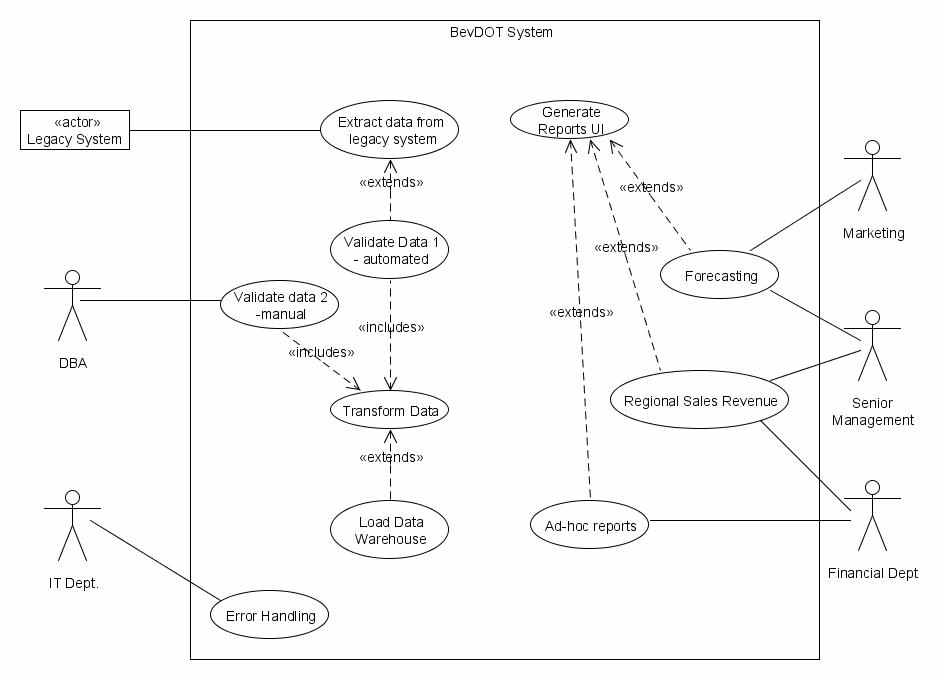
Use Case Diagram – 2nd Iteration