
IS1024 Project Team 7
| Вид материала | Документы |
- Point Team Services, входящий в состав ms project Server. Основные термины задача, 197.38kb.
- Project Expert 0, 587.79kb.
- Fast Street Team» Зимний Кубок клуба Fast Street Team по ралли-спринту «fst winter, 157.07kb.
- Microsoft Project Server. Microsoft Project Web Access Web-интерфейс для отчет, 98.46kb.
- Член Project Management Institute (pmi). Certified Senior Project Manager (cpm) Сертифицированный, 27.46kb.
- Software Project Management ) (базовый) по направлению: 511600 факультеты: фупм кафедра:, 41.85kb.
- Microsoft Project Portfolio Server Пример внедрения: решение, 374.46kb.
- Microsoft Office Project 2007-2010 программа, 121.65kb.
- Одним из лидирующих инструментов планирования бизнеса в условиях рынка, разработки, 42.42kb.
- Великий Новгород, ул. Псковская,, 12.23kb.
Preconditions: User is logged into the system. Database must be established with minimum of one (1) record.
Success Guarantee (Postcondition): A report is generated.
Main Scenario (Basic Flow):
1. System displays operations options on the GUI interface.
2. User chooses the generate report option.
3. System displays a report type screen.
4. User selects a report type from the menu.
5. System queries BevDOT for report-specific data.
7. BevDOT returns data to System.
8. System displays data in spreadsheet format.
9. System presents options to print results or export results.
Extensions (Alternative Flows):
4a. User chooses ‘Custom Reporting’ from the menu.
- System performs Generate Ad-Hoc Report.
4b. User chooses ‘Sales Forecasting Reporting’ from the menu.
- System generates Sales Forecasting Report.
4c. User chooses ‘Regional Reporting’ from the menu.
- System generates Regional Sales Report .
4d. User chooses ‘Seasonal Reporting’ from the menu.
- System Generates Seasonal Sales Report .
4e. User chooses ‘Tracking Reporting’ from the menu.
- System Generates Tracking Report .
4f. User chooses ‘System Reporting’ from the menu.
- System Generates System Efficiency Report .
4g. User chooses ‘Statistical Graphics Reporting’ from the menu.
- System Performs Create Graphs.
9a. Upon selection to print:
- System sends the query results to the print spooler.
- System sends print instructions to printer when queued job is called.
9b. Upon selection to export:
- System prompts user to name file and select file type
- User enters filename and selects type, selects export option
- System creates new file from report data.
*a. Upon detection of system failure:
- System displays error code
- System Performs Error Handling
- Restart step 1
Special Requirements: The Create Graphs use case will be dependent on data from other reports. It will generate graphics in accordance with other BevDOT reports, but will utilize templates specific to each report type.
Technology and Data Variations: None
Frequency of Occurrence: As needed
5.1h (creator: Bryan Defranco)
Use Case #8.0
Use Case Name: Generate Ad-Hoc Report
Description: Gives users ability to specify parameters to craft report output.
Scope: BevDOT System
Level: Sub function of Generate Reports
Primary Actor: Sales person, Marketing Agent, Accountant
Stakeholders and Interests: Senior management - will use reports to set and track goals at the company, division, and country level to anticipate trends and changes in the market over time to improve forecasting, and to make executive decisions based on product demand.
Preconditions: User is logged into the system. Reports menu is displayed.
Success Guarantee (Postcondition): Report is generated, critiqued to the users’ needs.
Main Scenario (Basic Flow):
- User chooses ‘Custom Reporting’ from the menu.
- System presents options for the user to choose a saved configuration, or create a new one
- User chooses ‘create new’
- System presents options screen for the user to select and/or key-in values
- User selects desired options and enters needed criteria.
- System checks for incomplete or improper specification
- System generates query from the users configuration.
- System queries data warehouse and displays results
- System presents options to print, save, save configuration, quit
Extensions (Alternative Flows):
2a. Upon selection to use saved configuration,
- System presents user with list of saved configurations
- User chooses the desired configuration from the menu
- Skip to step 7.
6a. Upon detection of bad specification:
- System informs user of the fields improperly or not filled
- System resumes at step 4
9a. Upon selection to print
- System sends the query results to the print spooler.
- System sends print instructions to printer when queued job is called.
9b. Upon the selection to export
- System prompts user to name file and select file type
- User enters filename and selects type, selects export option
- System creates new file from report data.
- System resumes at Step 9.
9c. Upon selection to save configuration
- System prompts for input of a name for the custom configuration
- User enters a name for the custom configuration
- System saves the query criteria in the database
- System resumes at step 9
9d. Upon selection to generate graph
- System Performs Create Graph
- System resumes at step 9
9d. Upon selection to quit
1. System presents the Reports menu
*a. Upon detection of system failure:
- System displays error code
- System Performs Error Handling
Special Requirements: None
Technology and Data Variations: None
Frequency of Occurrence: As needed
5.1i (creator: Mark Wimer and Bryan Defranco)
Use Case #9.0
Use Case Name: Create Graphs
Description: Gives users ability to create graphs in conjunction with existing BevDOT reports and previously saved ad-hoc reports. Users will use a 3rd party graphing tool to interpret BevDOT data for graph generation
Scope: BevDOT System
Level: Sub function of Generate Reports
Primary Actor: Sales person, Marketing Agent, Accountant, System Administrator, Database Administrator
Stakeholders and Interests: Sales, Marketing, Finance / Accounting, System Administrators, Database Administrators – will all have access to create graphs
Preconditions:
- User is logged into the system.
- Reports menu has been accessed and is displayed.
Success Guarantee (Postcondition): Graph is generated based on existing BevDOT reports, or previously saved ad-hoc reports.
Main Scenario (Basic Flow):
1. User chooses the ‘Graph Data’ option.
2. System displays a ‘Graph Type’ selection screen.
3. User selects a graph type from the available options.
4. System presents options to print results, export results, or quit.
Extensions (Alternative Flows):
3a. User chooses ‘Ad-hoc Graphical Reporting’ from the menu.
- Graphing tool prompts user for saved Ad-hoc configuration file.
- User selects desired Ad-hoc file.
- Graphing tool queries BevDOT with ad-hoc file configuration
- BevDOT returns data to Graphing tool
- Graphing tool interprets data and generates ad-hoc bar chart graph
3b. User chooses ‘Sales Forecasting Graph’ from the menu.
- Graphing tool queries BevDOT with report specific criteria
- BevDOT returns data to Graphing tool
- Graphing tool interprets data and generates Sales Forecasting bar chart graph .
3c. User chooses ‘Regional Sales Graph’ from the menu.
- Graphing tool queries BevDOT with report specific criteria
- BevDOT returns data to Graphing tool
- Graphing tool interprets data and generates Regional Sales bar chart graph.
3d. User chooses ‘Seasonal Sales Graph’ from the menu.
- Graphing tool queries BevDOT with report specific criteria
- BevDOT returns data to Graphing tool
- Graphing tool interprets data and Generates Seasonal Sales bar chart graph .
3e. User chooses ‘Tracking Graph’ from the menu.
- Graphing tool queries BevDOT with report specific criteria
- BevDOT returns data to Graphing tool
- Graphing tool interprets data and Generates Tracking bar chart graph .
3f. User chooses ‘Graphing tool Efficiency Graph’ from the menu.
1. Graphing tool queries BevDOT with report specific criteria
2 BevDOT returns data to Graphing tool
3. Graphing tool interprets data and Generates Graphing tool Efficiency bar chart graph .
7a. Upon selection to print
- System sends the query results to the print spooler.
- System sends print instructions to printer when queued job is called.
7b. Upon the selection to export
- System prompts user to name file and select file type
- User enters filename and selects type, selects export option
- System creates new file from report data.
- System resumes at Step 9.
7d. Upon selection to quit
1. System presents the Reports menu
*a. Upon detection of system failure:
- System displays error code
- System Performs Error Handling
Special Requirements: The 3rd party graphing tool must be used in this use case to create graphs
Technology and Data Variations: A 3rd party ad-on Graphing Component software will be incorporated. It will be customized to interpret BevDOT data and generate relative reports.
Frequency of Occurrence: As needed
[Bryan DeFranco]
1. Introduction
1.1 Purpose
The purpose of this document is to define requirements of the BevDOT system. This Supplementary Specification lists the requirements that are not readily captured in the use cases of the use-case model. The Supplementary Specifications and the use-case model together capture a complete set of requirements on the system.
1.2 Scope
This Supplementary Specification applies to the BevDOT System which will be developed by the Beverage Company, Inc. IT department. The IT department will develop this client-server system to interface with the existing legacy database system.
The BevDOT system will give users needed information that was not previously readily available. The BevDOT system will reduce the load on the existing Legacy system.
This specification defines the non-functional requirements of the system; such as reliability, usability, performance, and supportability as well as …
[Mark Wimer]
1.3 References
Applicable references are:
- BevDOT Vision Document, 2009, (Group 7) Beverage Company Inc.
- BevDOT Use Case Spec – Extract Data V3c, 2009, (Group 7) Beverage Company Inc.
- BevDOT Use Case Spec – Validate Data V3a, 2009, (Group 7) Beverage Company Inc.
- BevDOT Use Case Spec – Manual Validate Data V1, 2009, (Group 7) Beverage Company Inc.
- BevDOT Use Case Spec – Transform Data V3a, 2009, (Group 7) Beverage Company Inc.
- BevDOT Use Case Spec – Load Data V3a, 2009, (Group 7) Beverage Company Inc.
- BevDOT Use Case Spec – Generate Reports V2, 2009, (Group 7) Beverage Company Inc.
[Mark Wimer]
2. Functionality
2.1 System Error Handling
All system errors will be processed by the error handling use case. All errors will receive an error code and will be logged as stated within that use case.
All system errors will be coded and receive a basic text description which will be logged on to the BevDOT warehouse until they can be resolved, at which point they can be archived or purged from the system.
[Philip Boggs, Additions / modifications by Mark Wimer]
3. Usability
This section lists all of those requirements that relate to, or affect, the usability of the system.
3.1 Operating System Compliance
The desktop user-interface shall be platform dependent. The minimum operating system requirements shall be Microsoft Windows XP or later
3.2 Designed for Ease-of-Use
The user interface of the data warehouse shall be designed for ease-of-use and shall be appropriate for a computer-literate user community with a minimal level of training on the system. Will require basic windows navigation skills.
3.3 Help /Training
Training will be provided to all users after system implementation. Additional training on using the GUI interface and the performing queries will be held on an as needed basis determined by senior management.
[Mark Wimer]
4. Reliability
This section lists all reliability requirements.
4.1 Availability
The BevDOT Data Warehouse shall be available 24 hours a day, 7 days a week. There shall be no more than 1.0% down time. Exceptions exist only for scheduled maintenance, which should be a down time of no more than 36 hours on non-working days.
4.2 Mean Time Between Failures
Mean Time Between Failures shall exceed 500 hours.
[Philip Boggs, Additions / modifications by Mark Wimer]
5. Performance
The performance characteristics of the system are outlined in this section.
5.1 Simultaneous Users
The system shall support up to 500 simultaneous users against the central database at any given time, and up to 200 simultaneous users against the local servers at any one time.
5.2 Database Access Response Time
The BevDOT system shall respond in a time of no longer than 2 seconds during normal transactional operations.
The system shall provide access to the BevDOT database with no more than a 60 -180 second response time, Depending on the complexity of the query.
[Mark Wimer]
6. Supportability
6.1 Software Updates and Maintenance
To provide as much security as possible, BevDOT itself will not be connected to any external connections except for occasional software updates and maintenance, at which point a system administrator will enable the necessary intranet or internet connection(s). Any off-site access must be done through a VPN to the legacy system.
[Bryan DeFranco]
7. Design Constraints
7.1 Legacy System
The system shall integrate with the existing legacy database system.
The system shall clean and transform data from an operational format (Create, Read, Update, Delete) into an informational format, and store it in a data warehouse.
- Software platform requirements
The system shall use a modern, industry-standard data warehousing scheme. Refer to supplementary specification item #10
[Philip Boggs, Mark Wimer]
8. Documentation Requirements
This section will outline the documentation that will be included for a successful deployment of the product.
8.1 User Manual
The user manual will provide a purpose, table of contents, and glossary as well as detailed instructions on operating the product and troubleshooting for basic problems that may be encountered.
8.2 Online Help
The online help section will have a download link to an HTML-based user manual and a frequently asked questions page (FAQ).
Each feature of the data warehouse shall have an online help option selection available. Online Help shall include step by step instructions on using that system feature. Online Help shall include definitions for terms and acronyms
[Bryan DeFranco, Additions / modifications by Mark Wimer]
9. Maintenance
Periodical loading / ETL batch transformations from legacy database will take place during evening/night (non-business hours).Database integrity checks will occur on weekends, during non-business hours in scheduled conjunction with the ETL process. Complete system integrity checks will occur monthly.
[Section 10,11,12,by Michael Smolenski, Additions / modifications by Mark Wimer]
10. Applicable Standards
The BevDOT system must run an Oracle based Unix system. BevDOT data will be accessible through a client-side GUI interface. The interface must be compatible with a TCP/IP protocol accessed on a company controlled WAN. Firewalls must be in place to avoid outside users from accessing the WAN.
11. System Requirements
The BevDOT system will require four, IBM BladeCentre LS42 (79023LU) server blades. Each blade will utilize a Quad core Opteron processor @ 2.30 GHz. Each blade will also utilize 4 GB of DDR2 SDRAM. BevDOT will require a total of 2 terabytes of physical disk storage. Any additional BevDOT system requirements can be met through expansion in the existing BladeCenter E Chassis.
Each PC that interfaces with the sever must have at least 1 GB of memory and 250 MB of hard drive space to run the necessary queries. (Not including operating system)
12. Licensing, Security, and Installation
Four Oracle licenses will be needed for the server; one license per processor. Microsoft Windows licenses will be needed for the interfacing computers. Norton Antivirus software licenses will be needed for all computers in the network. Only authorized employees of Beverage Inc. will be allowed to access the system and updates will handled by the IT department staff.
[Bryan DeFranco]
- Technical Specification
13.1 Data and Technology Variations
13.1.1 Data Chunk
A data chunk is a sufficient amount of data to perform batch validation, transformation, and storage in data warehouse for a DB-unit of information. This typically will be less than 12 records, or 100K Bytes per chunk, but each chunk will vary is size.
A DB-unit of information is that which sufficient to create a meaningful storage in Data Warehouse informational format. This is bound by the external rules file.
13.1.2 Transformation and Validation Rules
Data extraction rules are specified outside of BevDOT, and define the data to retrieve. The rules file will also define table formats of Legacy system to facilitate ability to reconfigure if Legacy database structure changes in the future.
1. Introduction
Purpose
The purpose of this section was to begin designing and implementing the correct system. The system to be designed and implemented is the BevDot of the Beverage Company. Here we will construct the use-case realization, derive test-cases from use-cases, show the correlation between features and use-cases, and finally correlation between use-cases and test-cases.
2. 6.1 Use-case realization
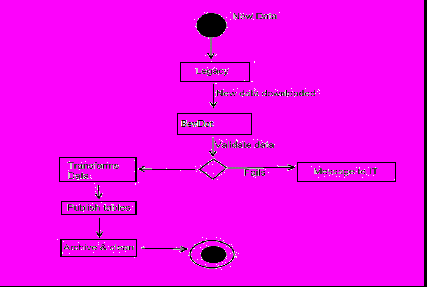
- Activity Diagram
The Following is an activity diagram of the Extract Transform and Load ETL. The activity diagram was used for a various reasons. The activity diagram shows work flow, complex use-case and much more.
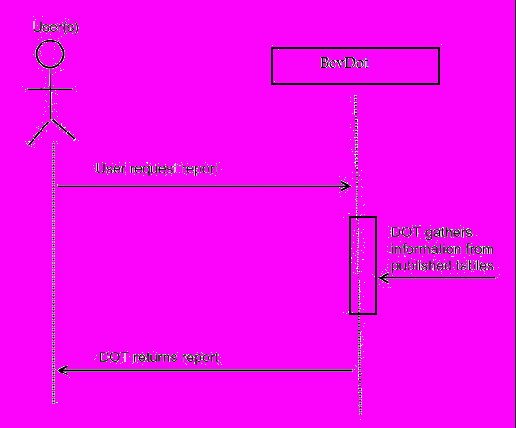
- Sequence Diagram
Here a sequence diagram is used to illustrate the Generate Reports use-case. The sequence diagram is used to depict time-ordered sequence between classes.
- Section 6.2 Derive Test-Cases from Use-Cases
- Identify Use Case Scenarios
- Identify Use Case Scenarios
Now with a few diagrams to help illustrate how the classes work in the BevDot system we must identify the use-case scenarios. Each scenario can be for more than one test-case. Once we identify the use-cases we must move to the next phase. Below are the scenarios that will have test-cases for.
- Generating Reports
- Extract Transform Load(ETL)
- Extract data from legacy system into BevDot
- Automatically Validate data
- Transform data
- Publish Tables
- Extract data from legacy system into BevDot
- Manual Validation
- Error Handling
- Graphical Representation of Reports
- Test Cases
The next phase involves deriving test-cases from use-cases. These test-cases are for each scenario of the BevDot system. Each test-case will identify conditions that cause execution. Will be completed by adding data values.
- Generating Reports